Aggregate statistics by Auto Scaling group
You can aggregate statistics for the EC2 instances in an Auto Scaling group. Metrics are completely separate between Regions, but you can use CloudWatch metric math to aggregate and transform metrics from multiple Regions. You can also use the cross-account dashboard to perform metric math on metrics from different accounts.
This example shows you how to get the total bytes written to disk for one Auto Scaling group. The total is computed for 1-minute periods for a 24-hour interval across all EC2 instances in the specified Auto Scaling group.
To display DiskWriteBytes for the instances in an Auto Scaling group using the console
-
Open the CloudWatch console at https://console.aws.amazon.com/cloudwatch/
. -
In the navigation pane, choose Metrics.
-
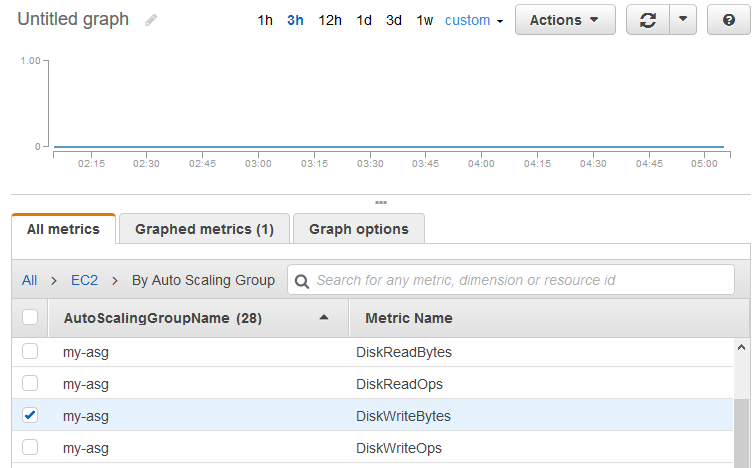
Choose the EC2 namespace and then choose By Auto Scaling Group.
-
Select the row for the DiskWriteBytes metric and the specific Auto Scaling group, which displays a graph for the metric for the instances in the Auto Scaling group. To change the name of the graph, choose the pencil icon. To change the time range, select one of the predefined values or choose custom.
-
To change the statistic, choose the Graphed metrics tab. Choose the column heading or an individual value and then choose one of the statistics or predefined percentiles, or specify a custom percentile (for example,
p95.45). -
To change the period, choose the Graphed metrics tab. Choose the column heading or an individual value and then choose a different value.
To get DiskWriteBytes for the instances in an Auto Scaling group using the AWS CLI
Use the get-metric-statistics command as follows.
aws cloudwatch get-metric-statistics --namespace AWS/EC2 --metric-name DiskWriteBytes --dimensions Name=AutoScalingGroupName,Value=my-asg--statistics "Sum" "SampleCount" \ --start-time2016-10-16T23:18:00--end-time2016-10-18T23:18:00--period 360
The following is example output.
{
    "Datapoints": [
        {
            "SampleCount": 18.0,
            "Timestamp": "2016-10-19T21:36:00Z",
            "Sum": 0.0,
            "Unit": "Bytes"
        },
        {
            "SampleCount": 5.0,
            "Timestamp": "2016-10-19T21:42:00Z",
            "Sum": 0.0,
            "Unit": "Bytes"
        }
    ],
    "Label": "DiskWriteBytes"
}
