Aggregate statistics by Amazon Machine Image (AMI)
You can aggregate statistics for the EC2 instances that have detailed monitoring enabled. Instances that use basic monitoring aren't included. For more information, see Enable or Disable Detailed Monitoring for Your Instances in the Amazon EC2 User Guide.
This example shows you how to determine average CPU utilization for all instances that use the specified AMI. The average is over 60-second time intervals for a one-day period.
To display the average CPU utilization by AMI using the console
-
Open the CloudWatch console at https://console.aws.amazon.com/cloudwatch/
. -
In the navigation pane, choose Metrics, All metrics.
-
Choose the EC2 namespace and then choose By Image (AMI) Id.
-
Select the row for the
CPUUtilizationmetric and the specific AMI, which displays a graph for the metric for the specified AMI. To change the name of the graph, choose the pencil icon. To change the time range, select one of the predefined values or choose custom.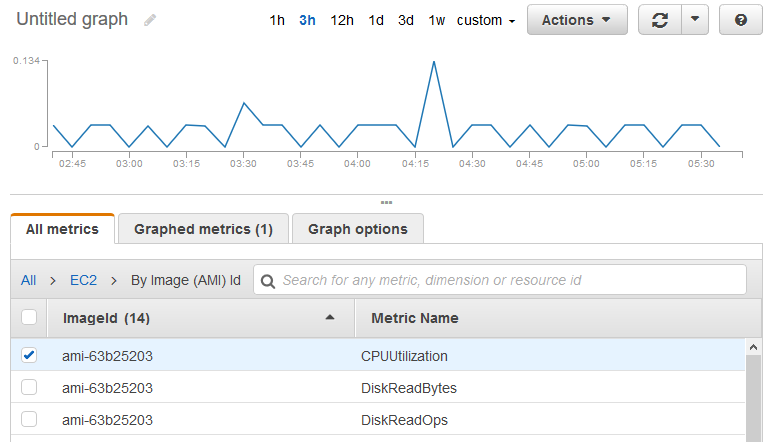
-
To change the statistic, choose the Graphed metrics tab. Choose the column heading or an individual value and then choose one of the statistics or predefined percentiles, or specify a custom percentile (for example,
p95.45). -
To change the period, choose the Graphed metrics tab. Choose the column heading or an individual value and then choose a different value.
To get the average CPU utilization by AMI using the AWS CLI
Use the get-metric-statistics command as follows.
aws cloudwatch get-metric-statistics --namespace AWS/EC2 --metric-name CPUUtilization \ --dimensions Name=ImageId,Value=ami-3c47a355--statistics Average \ --start-time2016-10-10T00:00:00--end-time2016-10-11T00:00:00--period 3600
The operation returns statistics that are one-hour values for the one-day interval. Each value represents an average CPU utilization percentage for EC2 instances running the specified AMI. The following is example output.
{
    "Datapoints": [
        {
            "Timestamp": "2016-10-10T07:00:00Z",
            "Average": 0.041000000000000009,
            "Unit": "Percent"
        },
        {
            "Timestamp": "2016-10-10T14:00:00Z",
            "Average": 0.079579831932773085,
            "Unit": "Percent"
        },
        {
            "Timestamp": "2016-10-10T06:00:00Z",
            "Average": 0.036000000000000011,
            "Unit": "Percent"
        },
        ...
    ],
    "Label": "CPUUtilization"
}
