Modify the y-axis for a graph
You can set custom bounds for the y-axis on a graph to help you see the data better. For
example, you can change the bounds on a CPUUtilization graph to 100 percent so
that it's easy to see whether the CPU is low (the plotted line is near the bottom of the
graph) or high (the plotted line is near the top of the graph).
You can switch between two different y-axes for your graph. This is useful if the graph contains metrics that have different units or that differ greatly in their range of values.
To modify the y-axis on a graph
-
Open the CloudWatch console at https://console.aws.amazon.com/cloudwatch/
. -
In the navigation pane, choose Metrics, All metrics.
-
Select a metric namespace (for example, EC2) and then a metric dimension (for example, Per-Instance Metrics).
-
The All metrics tab displays all metrics for that dimension in that namespace. To graph a metric, select the check box next to the metric.
-
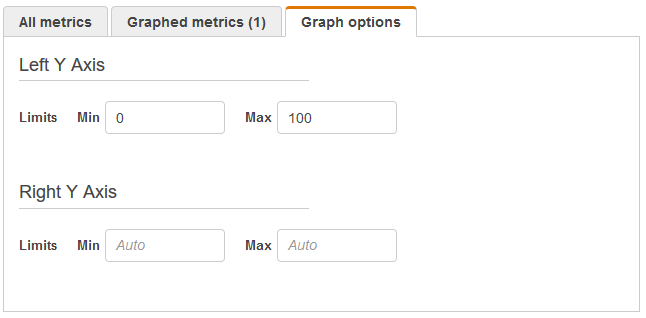
On the Graph options tab, specify the Min and Max values for Left Y Axis. The value of Min can't be greater than the value of Max.
-
To create a second y-axis, specify the Min and Max values for Right Y Axis.
-
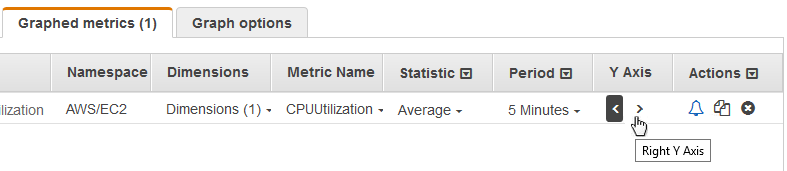
To switch between the two y-axes, choose the Graphed metrics tab. For Y Axis, choose Left Y Axis or Right Y Axis.