Working with test reports in Device Farm
Use the Device Farm console to view your test reports. For more information, see Reports in AWS Device Farm.
Prerequisites
Set up a test run and verify that it is complete.
-
To create a run, see Create a test run in Device Farm, and then return to this page.
-
Verify that the run is complete. During your test run, the Device Farm console displays a pending icon
 for runs that are in progress. Each device in the run will also start with the
pending icon, then switch to the running
for runs that are in progress. Each device in the run will also start with the
pending icon, then switch to the running
 icon when the test begins. As each test
finishes, a test result icon is displayed next to the device name. When all tests have been
completed, the pending icon next to the run changes to a test result icon. For more information, see
Understanding test results.
icon when the test begins. As each test
finishes, a test result icon is displayed next to the device name. When all tests have been
completed, the pending icon next to the run changes to a test result icon. For more information, see
Understanding test results.
Understanding test results
The Device Farm console displays icons that help you quickly assess the state of your completed test run.
Reporting results for an individual test
For reports that describe an individual test, Device Farm displays an icon:
| Description | Icon |
|---|---|
| The test succeeded. |

|
| The test failed. |

|
| Device Farm skipped the test. |

|
| The test stopped. |

|
| Device Farm returned a warning. |

|
| Device Farm returned an error. |

|
Reporting results for multiple tests
If you choose a finished run, Device Farm displays a test results summary graph.
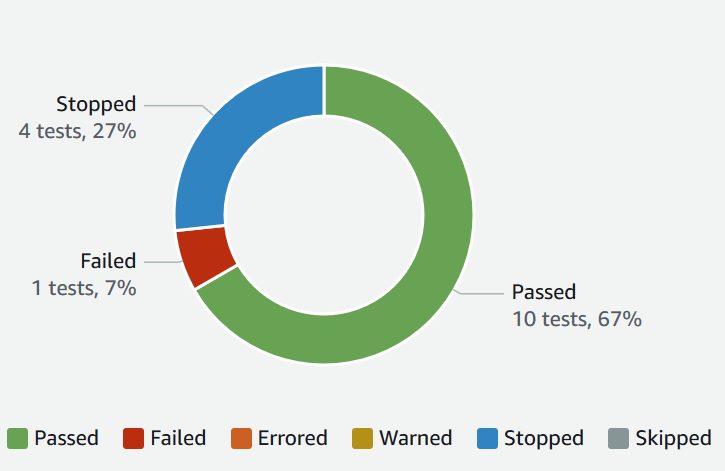
For example, this test run results graph shows that the run had 4 stopped tests, 1 failed test, and 10 successful tests.
Graphs are always color coded and labeled.
Viewing reports
You can view the results of your test in the Device Farm console.
Topics
View the test run summary page
Sign in to the Device Farm console at https://console.aws.amazon.com/devicefarm
. -
In the navigation pane, choose Mobile Device Testing, and then choose Projects.
-
In the list of projects, choose the project for the run.
Tip
To filter the project list by name, use the search bar.
-
Choose a completed run to view its summary report page.
-
The test run summary page displays an overview of your test results.
-
The Unique problems section lists unique warnings and failures. To view unique problems, follow the instructions in View unique problem reports.
-
The Devices section displays the total number of tests, by outcome, for each device.
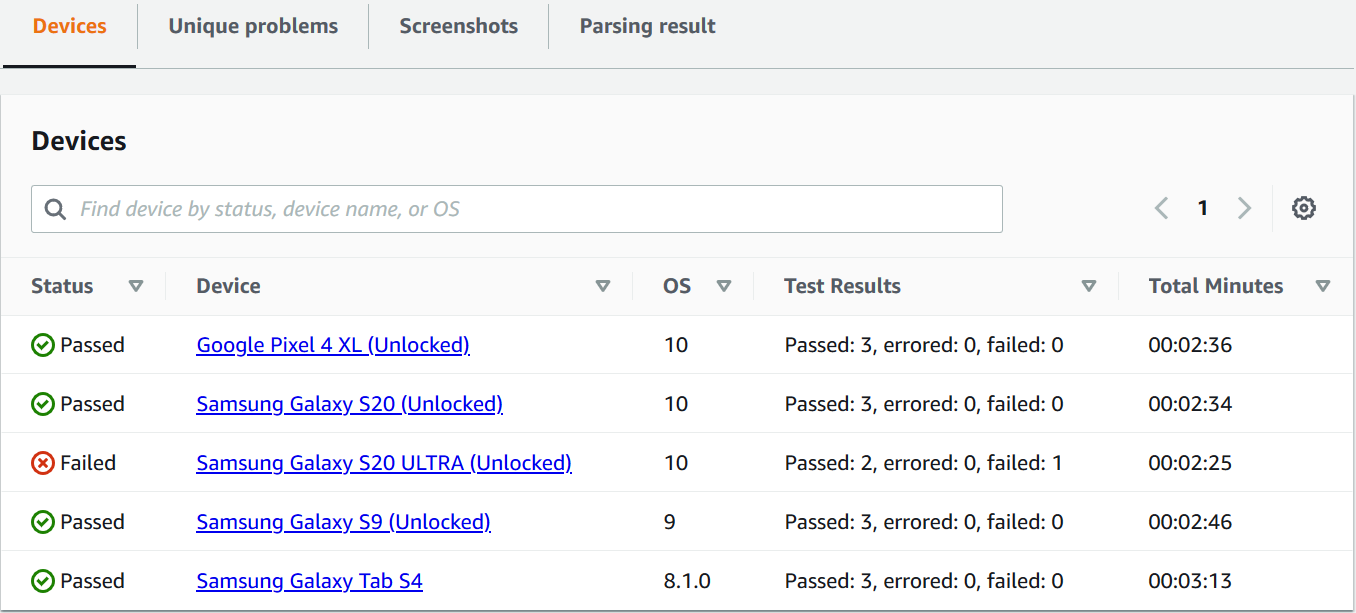
In this example, there are several devices. In the first table entry, the Google Pixel 4 XL device running Android version 10 reports three successful tests that took 02:36 minutes to run.
To view the results by device, follow the instructions in View device reports.
-
The Screenshots section displays a list of any screenshots that Device Farm captured during the run, grouped by device.
-
In the Parsing result section, you can download the parsing result.
-
View unique problem reports
-
In Unique problems, choose the problem that you want to view.
-
Choose the device. The report displays information about the problem.
The Video section displays a downloadable video recording of the test.
The Result section displays the result of the test. The status is represented as a result icon. For more information, see Reporting results for an individual test.
The Logs section displays any information that Device Farm logged during the test. To view this information, follow the instructions in View log information for a problem, device, suite, or test in a report.
The Performance tab displays information about any performance data that Device Farm generated during the test. To view this performance data, follow the instructions in View performance data for a problem, device, suite, or test in a report.
The Files tab displays a list of any of the test's associated files (such as log files) that you can download. To download a file, choose the file's link in the list.
The Screenshots tab displays a list of any screenshots that Device Farm captured during the test.
View device reports
-
In the Devices section, choose the device.
The Video section displays a downloadable video recording of the test.
The Suites section displays a table containing information about the suites for the device.
In this table, the Test results column summarizes the number of tests by outcome for each of the test suites that have run on the device. This data also has a graphical component. For more information, see Reporting results for multiple tests.
To view the full results by suite, follow the instructions in View test suite reports.
The Logs section displays any information that Device Farm logged for the device during the run. To view this information, follow the instructions in View log information for a problem, device, suite, or test in a report.
The Performance section displays information about any performance data that Device Farm generated for the device during the run. To view this performance data, follow the instructions in View performance data for a problem, device, suite, or test in a report.
The Files section displays a list of suites for the device and any associated files (such as log files) that you can download. To download a file, choose the file's link in the list.
The Screenshots section displays a list of any screenshots that Device Farm captured during the run for the device, grouped by suite.
View test suite reports
-
In the Devices section, choose the device.
-
In the Suites section, choose the suite from the table.
The Video section displays a downloadable video recording of the test.
The Tests section displays a table containing information about the tests in the suite.
In the table, the Test results column displays the result. This data also has a graphical component. For more information, see Reporting results for multiple tests.
To view the full results by test, follow the instructions in View test reports.
The Logs section displays any information that Device Farm logged during the run for the suite. To view this information, follow the instructions in View log information for a problem, device, suite, or test in a report.
The Performance section displays information about any performance data that Device Farm generated during the run for the suite. To view this performance data, follow the instructions in View performance data for a problem, device, suite, or test in a report.
The Files section displays a list of tests for the suite and any associated files (such as log files) that you can download. To download a file, choose the file's link in the list.
The Screenshots section displays a list of any screenshots that Device Farm captured during the run for the suite, grouped by test.
View test reports
-
In the Devices section, choose the device.
-
In the Suites section, choose the suite.
-
In the Tests section, choose the test.
-
The Video section displays a downloadable video recording of the test.
The Result section displays the result of the test. The status is represented as a result icon. For more information, see Reporting results for an individual test.
The Logs section displays any information that Device Farm logged during the test. To view this information, follow the instructions in View log information for a problem, device, suite, or test in a report.
The Performance tab displays information about any performance data that Device Farm generated during the test. To view this performance data, follow the instructions in View performance data for a problem, device, suite, or test in a report.
The Files tab displays a list of any of the test's associated files (such as log files) that you can download. To download a file, choose the file's link in the list.
The Screenshots tab displays a list of any screenshots that Device Farm captured during the test.
View performance data for a problem, device, suite, or test in a report
Note
Device Farm collects device performance data only for Android devices at this time.
The Performance tab displays the following information:
-
The CPU graph displays the percentage of CPU that the app used on a single core during the selected problem, device, suite, or test (along the vertical axis) over time (along the horizontal axis).
The vertical axis is expressed in percentages, from 0% to the maximum recorded percentage.
This percentage might exceed 100% if the app used more than one core. For example, if three cores are at 60% usage, this percentage is displayed as 180%.
-
The Memory graph displays the number of MB that the app used during the selected problem, device, suite, or test (along the vertical axis) over time (along the horizontal axis).
The vertical axis is expressed in MB, from 0 MB to the maximum number of recorded MB.
-
The Threads graph displays the number of threads used during the selected problem, device, suite, or test (along the vertical axis) over time (along the horizontal axis).
The vertical axis is expressed in number of threads, from zero threads to the maximum number of recorded threads.
In all cases, the horizontal axis is represented, in seconds, from the start and end of the run for the selected problem, device, suite, or test.
To display information for a specific data point, pause in the desired graph at the desired second along the horizontal axis.
View log information for a problem, device, suite, or test in a report
The Logs section displays the following information:
-
Source represents the source of a log entry. Possible values include:
-
Harness represents a log entry that Device Farm created. These log entries are typically created during start and stop events.
-
Device represents a log entry that the device created. For Android, these log entries are logcat-compatible. For iOS, these log entries are syslog-compatible.
-
Test represents a log entry that either a test or its test framework created.
-
-
Time represents the elapsed time between the first log entry and this log entry. The time is expressed in
MM:SS.SSSformat, whereMrepresents minutes andSrepresents seconds. -
PID represents the process identifier (PID) that created the log entry. All log entries created by an app on a device have the same PID.
-
Level represents the logging level for the log entry. For example,
Logger.debug("This is a message!")logs a Level ofDebug. These are the possible values:-
Alert
-
Critical
-
Debug
-
Emergency
-
Error
-
Errored
-
Failed
-
Info
-
Internal
-
Notice
-
Passed
-
Skipped
-
Stopped
-
Verbose
-
Warned
-
Warning
-
-
Tag represents arbitrary metadata for the log entry. For example, Android logcat can use this to describe which part of the system created the log entry (for example,
ActivityManager). -
Message represents the message or data for the log entry. For example,
Logger.debug("Hello, World!")logs a Message of"Hello, World!".
To display only a portion of the information:
-
To show all log entries that match a value for a specific column, enter the value into the search bar. For example, to show all log entries with a Source value of
Harness, enterHarnessin the search bar. -
To remove all of the characters from a column header box, choose the X in that column header box. Removing all of the characters from a column header box is the same as entering
*in that column header box.
To download all of the log information for the device, including all of the suites and tests that you ran, choose Download logs.
