Monitoring AWS DMS tasks
Monitoring is an important part of maintaining the reliability, availability, and performance of AWS DMS and your AWS solutions. You should collect monitoring data from all of the parts of your AWS solution so that you can more easily debug a multi-point failure if one occurs. AWS provides several tools for monitoring your AWS DMS tasks and resources, and responding to potential incidents:
- AWS DMS events and notifications
-
AWS DMS uses Amazon Simple Notification Service (Amazon SNS) to provide notifications when an AWS DMS event occurs, for example the creation or deletion of a replication instance. AWS DMS groups events into categories that you can subscribe to, so you can be notified when an event in that category occurs. For example, if you subscribe to the Creation category for a given replication instance, you are notified whenever a creation-related event occurs that affects your replication instance. You can work with these notifications in any form supported by Amazon SNS for an AWS Region, such as an email message, a text message, or a call to an HTTP endpoint. For more information, see Working with Amazon SNS events and notifications in AWS Database Migration Service
- Task status
-
You can monitor the progress of your task by checking the task status and by monitoring the task's control table. Task status indicates the condition of a AWS DMS task and its associated resources. It includes such indications as if the task is being created, starting, running, or stopped. It also includes the current state of the tables that the task is migrating, such as if a full load of a table has begun or is in progress and details such as the number of inserts, deletes, and updates have occurred for the table. For more information about monitoring task and task resource condition, see Task status and Table state during tasks. For more information about control tables, see Control table task settings.
- Amazon CloudWatch alarms and logs
-
Using Amazon CloudWatch alarms, you watch one or more task metrics over a time period that you specify. If a metric exceeds a given threshold, a notification is sent to an Amazon SNS topic. CloudWatch alarms do not invoke actions because they are in a particular state. Rather the state must have changed and been maintained for a specified number of periods. AWS DMS also uses CloudWatch to log task information during the migration process. You can use the AWS CLI or the AWS DMS API to view information about the task logs. For more information about using CloudWatch with AWS DMS, see Monitoring replication tasks using Amazon CloudWatch. For more information about monitoring AWS DMS metrics, see AWS Database Migration Service metrics. For more information about using AWS DMS task logs, see Viewing and managing AWS DMS task logs.
- Time Travel logs
-
To log and debug replication tasks, you can use AWS DMS Time Travel. In this approach, you use Amazon S3 to store logs and encrypt them using your encryption keys. You can retrieve your S3 logs using date-time filters, then view, download, and obfuscate logs as needed. By doing this, you can "travel back in time" to investigate database activities.
You can use Time Travel with DMS-supported PostgreSQL source endpoints and DMS-supported PostgreSQL and MySQL target endpoints. You can turn on Time Travel only for full-load and CDC tasks and for CDC only tasks. To turn on Time Travel or to modify any existing Time Travel settings, ensure that your task is stopped.
For more information about Time Travel logs, see Time Travel task settings. For best practices for using Time Travel logs, see Troubleshooting replication tasks with Time Travel.
- AWS CloudTrail logs
-
AWS DMS is integrated with AWS CloudTrail, a service that provides a record of actions taken by a user, IAM role, or an AWS service in AWS DMS. CloudTrail captures all API calls for AWS DMS as events, including calls from the AWS DMS console and from code calls to the AWS DMS API operations. If you create a trail, you can enable continuous delivery of CloudTrail events to an Amazon S3 bucket, including events for AWS DMS. If you don't configure a trail, you can still view the most recent events in the CloudTrail console in Event history. Using the information collected by CloudTrail, you can determine the request that was made to AWS DMS, the IP address from which the request was made, who made the request, when it was made, and additional details. For more information, see Logging AWS DMS API calls with AWS CloudTrail.
- Database logs
-
You can view, download, and watch database logs for your task endpoints using the AWS Management Console, AWS CLI, or the API for your AWS database service. For more information, see the documentation for your database service at AWS documentation.
For more information, see the following topics.
Topics
Task status
The task status indicates the condition of the task. The following table shows the possible statuses a task can have:
| Task status | Description |
|---|---|
|
Creating |
AWS DMS is creating the task. |
|
Running |
The task is performing the migration duties specified. |
|
Stopped |
The task is stopped. |
|
Stopping |
The task is being stopped. This is usually an indication of user intervention in the task. |
|
Deleting |
The task is being deleted, usually from a request for user intervention. |
|
Failed |
The task has failed. For more information, see the task log files. |
|
Error |
The task stopped due to an error. A brief description of the task error is provided in the last failure message section of the Overview tab. |
|
Running with errors |
The task is running with an error status. This usually indicates that one or more of the tables in the task couldn't be migrated. The task continues to load other tables according to the selection rules. |
|
Starting |
The task is connecting to the replication instance and to the source and target endpoints. Any filters and transformations are being applied. |
|
Ready |
The task is ready to run. This status usually follows the "creating" status. |
|
Modifying |
The task is being modified, usually due to a user action that modified the task settings. |
|
Moving |
The task is in the process of being moved to another replication instance. The replication remains in this state until the move is complete. Deleting the task is the only operation allowed on the replication task while it’s being moved. |
|
Failed-move |
The task move has failed for any reason, such as not having enough storage space on the target replication instance. When a replication task is in this state, it can be started, modified, moved, or deleted. |
|
Testing |
The database migration specified for this task is being tested in response to running either the StartReplicationTaskAssessmentRun , or the StartReplicationTaskAssessment operation. |
The task status bar gives an estimation of the task's progress. The quality of this estimate depends on the quality of the source database's table statistics; the better the table statistics, the more accurate the estimation. For tasks with only one table that has no estimated rows statistic, we are unable to provide any kind of percentage complete estimate. In this case, the task state and the indication of rows loaded can be used to confirm that the task is indeed running and making progress.
Note that the "last updated" column the DMS console only indicates the time that AWS DMS last updated the table statistics record for a table. It does not indicate the time of the last update to the table.
In addition to using the DMS console, you can output a description
of current replication tasks, including task status, by using the aws dms
describe-replication-tasks command in the AWS CLI, as
shown in the following example.
{
    "ReplicationTasks": [
        {
            "ReplicationTaskIdentifier": "moveit2",
            "SourceEndpointArn": "arn:aws:dms:us-east-1:123456789012:endpoint:6GGI6YPWWGAYUVLKIB732KEVWA",
            "TargetEndpointArn": "arn:aws:dms:us-east-1:123456789012:endpoint:EOM4SFKCZEYHZBFGAGZT3QEC5U",
            "ReplicationInstanceArn": "arn:aws:dms:us-east-1:123456789012:rep:T3OM7OUB5NM2LCVZF7JPGJRNUE",
            "MigrationType": "full-load",
            "TableMappings": ...output omitted... ,
            "ReplicationTaskSettings": ...output omitted... ,
            "Status": "stopped",
            "StopReason": "Stop Reason FULL_LOAD_ONLY_FINISHED",
            "ReplicationTaskCreationDate": 1590524772.505,
            "ReplicationTaskStartDate": 1590619805.212,
            "ReplicationTaskArn": "arn:aws:dms:us-east-1:123456789012:task:K55IUCGBASJS5VHZJIINA45FII",
            "ReplicationTaskStats": {
                "FullLoadProgressPercent": 100,
                "ElapsedTimeMillis": 0,
                "TablesLoaded": 0,
                "TablesLoading": 0,
                "TablesQueued": 0,
                "TablesErrored": 0,
                "FreshStartDate": 1590619811.528,
                "StartDate": 1590619811.528,
                "StopDate": 1590619842.068
            }
        }
    ]
}
Table state during tasks
The AWS DMS console updates information regarding the state of your tables during migration. The following table shows the possible state values:
| State | Description |
|---|---|
|
Table does not exist |
AWS DMS cannot find the table on the source endpoint. |
|
Before load |
The full load process has been enabled, but it hasn't started yet. |
|
Full load |
The full load process is in progress. |
|
Table completed |
Full load has completed. |
|
Table cancelled |
Loading of the table has been cancelled. |
|
Table error |
An error occurred when loading the table. |
Monitoring replication tasks using Amazon CloudWatch
You can use Amazon CloudWatch alarms or events to more closely track your migration. For more information about Amazon CloudWatch, see What are Amazon CloudWatch, Amazon CloudWatch Events, and Amazon CloudWatch Logs? in the Amazon CloudWatch User Guide. Note that there is a charge for using Amazon CloudWatch.
If your replication task doesn't create CloudWatch logs, see AWS DMS does not create CloudWatch logs in the troubleshooting guide.
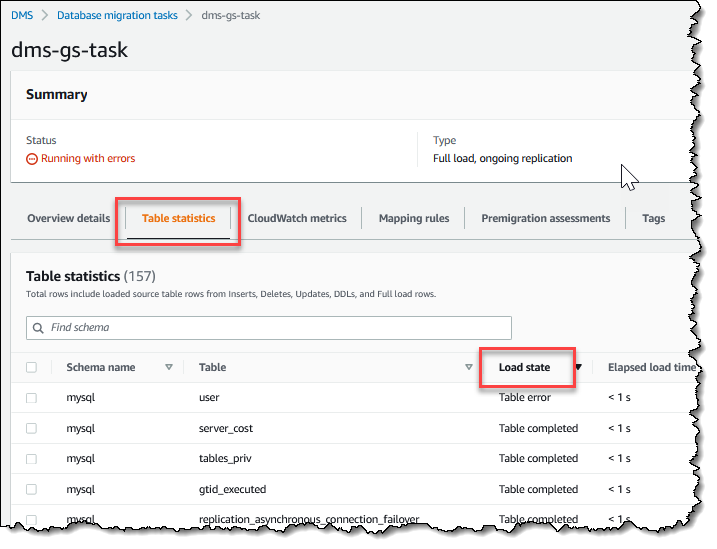
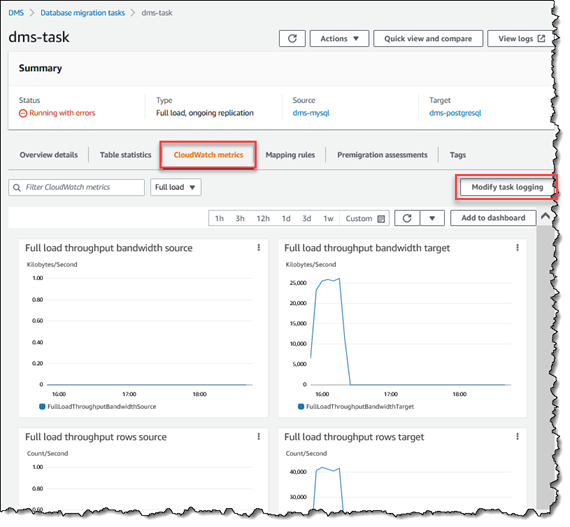
The AWS DMS console shows basic CloudWatch statistics for each task, including the task status, percent complete, elapsed time, and table statistics, as shown following. Select the replication task and then select the CloudWatch metrics tab.
To view and modify the CloudWatch task log settings, choose Modify task logging. For more information, see Logging task settings.
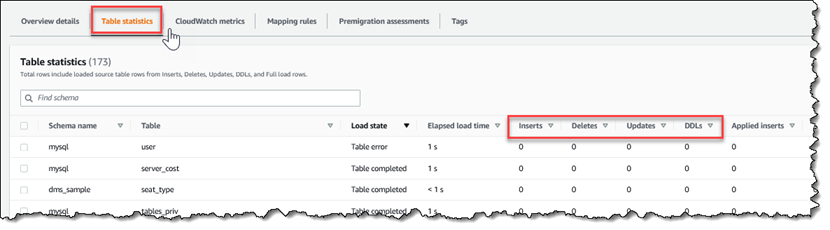
The AWS DMS console shows performance statistics for each table, including the number of inserts, deletions, and updates, when you select the Table statistics tab.
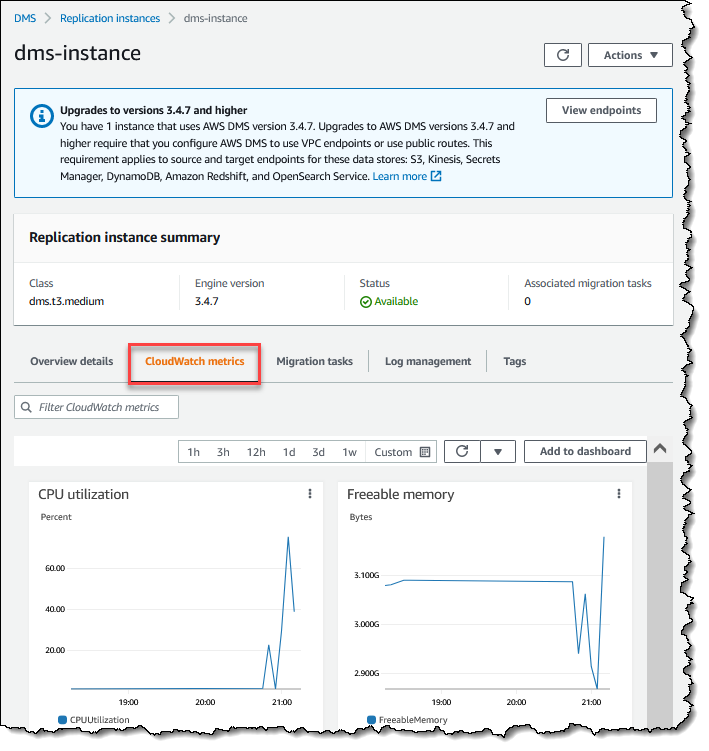
In addition, if you select a replication instance from the Replication Instance page, you can view performance metrics for the instance by choosing the CloudWatch metrics tab.
AWS Database Migration Service metrics
AWS DMS provides statistics for the following:
Host Metrics – Performance and utilization statistics for the replication host, provided by Amazon CloudWatch. For a complete list of the available metrics, see Replication instance metrics.
Replication Task Metrics – Statistics for replication tasks including incoming and committed changes, and latency between the replication host and both the source and target databases. For a complete list of the available metrics, see Replication task metrics.
Table Metrics – Statistics for tables that are in the process of being migrated, including the number of insert, update, delete, and DDL statements completed.
Task metrics are divided into statistics between the replication host and the source endpoint, and statistics between the replication host and the target endpoint. You can determine the total statistic for a task by adding two related statistics together. For example, you can determine the total latency, or replica lag, for a task by combining the CDCLatencySource and CDCLatencyTarget values.
Task metric values can be influenced by current activity on your source database. For example, if a transaction has begun, but has not been committed, then the CDCLatencySource metric continues to grow until that transaction has been committed.
For the replication instance, the FreeableMemory metric requires clarification. Freeable memory is not a indication of the actual free memory available. It is the memory that is currently in use that can be freed and used for other uses; it's is a combination of buffers and cache in use on the replication instance.
While the FreeableMemory metric does not reflect actual free memory available, the combination of the FreeableMemory and SwapUsage metrics can indicate if the replication instance is overloaded.
Monitor these two metrics for the following conditions:
The FreeableMemory metric approaching zero.
The SwapUsage metric increases or fluctuates.
If you see either of these two conditions, they indicate that you should consider moving to a larger replication instance. You should also consider reducing the number and type of tasks running on the replication instance. Full Load tasks require more memory than tasks that just replicate changes.
To roughly estimate the actual memory requirements for an AWS DMS migration task, you can use the following parameters.
- LOB columns
An average number of LOB columns in each table in your migration scope.
- Maximum number of tables to load in parallel
The maximum number of tables that AWS DMS loads in parallel in one task.
The default value is 8.
- LOB chunk size
The size of the LOB chunks, in kilobytes, that AWS DMS uses to replicate data to the target database.
- Commit rate during full load
The maximum number of records that AWS DMS can transfer in parallel.
The default value is 10,000.
- LOB size
The maximum size of an individual LOB, in kilobytes.
- Bulk array size
The maximum number of rows that are fetched or processed by your endpoint driver. This value depends on the driver settings.
The default value is 1,000.
After you determine these values, you can use one of the following methods to estimate the amount of required memory for your migration task. These methods depend on the option that you choose for LOB column settings in your migration task.
-
For Full LOB mode, use the following formula.
Required memory = (LOB columns) * (Maximum number of tables to load in parallel) *
                    (LOB chunk size) * (Commit rate during full load)
Consider an example where your source tables include on average 2 LOB columns, and the size of the LOB chunks is 64 KB. If you use the default values for
Maximum number of tables to load in parallelandCommit rate during full load, then the amount of required memory for your task is as follows.Required memory = 2 * 8 * 64 * 10,000 = 10,240,000 KBNote
To reduce the value of Commit rate during full load, open the AWS DMS console, choose Database migration tasks, and create or modify a task. Expand Advanced settings, and enter your value for Commit rate during full load.
-
For Limited LOB mode, use the following formula.
Required memory = (LOB columns) * (Maximum number of tables to load in parallel) *
                    (LOB size) * (Bulk array size)
Consider an example where your source tables include on average 2 LOB columns, and the maximum size of an individual LOB is 4,096 KB. If you use the default values for
Maximum number of tables to load in parallelandBulk array size, then the amount of required memory for your task is as follows.Required memory = 2 * 8 * 4,096 * 1,000 = 65,536,000 KB
For AWS DMS to perform conversions optimally, the CPU must be available when the conversions happen. Overloading the CPU and not having enough CPU resources can result in slow migrations. AWS DMS can be CPU-intensive, especially when performing heterogeneous migrations and replications such as migrating from Oracle to PostgreSQL. Use of a C4 replication instance class can be a good choice for these situations. For more information, see Choosing the right AWS DMS replication instance for your migration.
Replication instance metrics
Replication instance monitoring includes Amazon CloudWatch metrics for the following statistics.
|
Metric |
Description |
|---|---|
| AvailableMemory |
An estimate of how much memory is available for starting new
applications, without swapping. For more information, see
Units: Bytes |
| CPUAllocated |
The percentage of CPU maximally allocated for the task (0 means no limit). AWS DMS raises this metric against the combined dimensions of Units: Percent |
| CPUUtilization |
The percentage of allocated vCPU (virtual CPU) currently in use on the instance. Units: Percent |
| DiskQueueDepth |
The number of outstanding read/write requests (I/Os) waiting to access the disk. Units: Count |
| FreeStorageSpace |
The amount of available storage space. Units: Bytes |
| FreeMemory |
The amount of physical memory available for use by
applications, page cache, and for the kernel’s own data
structures. For more information, see Units: Bytes |
| FreeableMemory |
The amount of available random access memory. Units: Bytes |
| MemoryAllocated |
The maximum allocation of memory for the task (0 means no limits). AWS DMS raises this metric against the combined dimensions of Units: MiB |
| WriteIOPS |
The average number of disk write I/O operations per second. Units: Count/Second |
| ReadIOPS |
The average number of disk read I/O operations per second. Units: Count/Second |
| WriteThroughput |
The average number of bytes written to disk per second. Units: Bytes/Second |
| ReadThroughput |
The average number of bytes read from disk per second. Units: Bytes/Second |
| WriteLatency |
The average amount of time taken per disk I/O (output) operation. Units: Milliseconds |
| ReadLatency |
The average amount of time taken per disk I/O (input) operation. Units: Milliseconds |
| SwapUsage |
The amount of swap space used on the replication instance. Units: Bytes |
| NetworkTransmitThroughput |
The outgoing (Transmit) network traffic on the replication instance, including both customer database traffic and AWS DMS traffic used for monitoring and replication. Units: Bytes/second |
| NetworkReceiveThroughput |
The incoming (Receive) network traffic on the replication instance, including both customer database traffic and AWS DMS traffic used for monitoring and replication. Units: Bytes/second |
Replication task metrics
Replication task monitoring includes metrics for the following statistics.
|
Metric |
Description |
|---|---|
| FullLoadThroughputBandwidthTarget |
Outgoing data transmitted from a full load for the target in KB per second. |
| FullLoadThroughputRowsTarget |
Outgoing changes from a full load for the target in rows per second. |
| CDCIncomingChanges |
The total number of change events at a point-in-time that are waiting to be applied to the target. Note that this is not the same as a measure of the transaction change rate of the source endpoint. A large number for this metric usually indicates AWS DMS is unable to apply captured changes in a timely manner, thus causing high target latency. |
| CDCChangesMemorySource |
Amount of rows accumulating in a memory and waiting to be committed from the source. You can view this metric together with CDCChangesDiskSource. |
| CDCChangesMemoryTarget |
Amount of rows accumulating in a memory and waiting to be committed to the target. You can view this metric together with CDCChangesDiskTarget. |
| CDCChangesDiskSource |
Amount of rows accumulating on disk and waiting to be committed from the source. You can view this metric together with CDCChangesMemorySource. |
| CDCChangesDiskTarget |
Amount of rows accumulating on disk and waiting to be committed to the target. You can view this metric together with CDCChangesMemoryTarget. |
| CDCThroughputBandwidthTarget |
Outgoing data transmitted for the target in KB per second. CDCThroughputBandwidth records outgoing data transmitted on sampling points. If no task network traffic is found, the value is zero. Because CDC does not issue long-running transactions, network traffic may not be recorded. |
| CDCThroughputRowsSource |
Incoming task changes from the source in rows per second. |
| CDCThroughputRowsTarget |
Outgoing task changes for the target in rows per second. |
| CDCLatencySource |
The gap, in seconds, between the last event captured from the source endpoint and current system time stamp of the AWS DMS instance. CDCLatencySource represents the latency between source and replication instance. High CDCLatencySource means the process of capturing changes from source is delayed. To identify latency in an ongoing replication, you can view this metric together with CDCLatencyTarget. If both CDCLatencySource and CDCLatencyTarget are high, investigate CDCLatencySource first. CDCSourceLatency can be 0 when there is no replication lag between the source and the replication instance. CDCSourceLatency can also become zero when the replication task attempts to read the next event in the source's transaction log and there are no new events compared to the last time it read from the source. When this happens, the task resets the CDCSourceLatency to 0. |
| CDCLatencyTarget |
The gap, in seconds, between the first event timestamp waiting to commit on the target and the current timestamp of the AWS DMS instance. Target latency is the difference between the replication instance server time and the oldest unconfirmed event id forwarded to a target component. In other words, target latency is the timestamp difference between the replication instance and the oldest event applied but unconfirmed by TRG endpoint (99%). When CDCLatencyTarget is high, it indicates the process of applying change events to the target is delayed. To identify latency in an ongoing replication, you can view this metric together with CDCLatencySource. If CDCLatencyTarget is high but CDCLatencySource isn’t high, investigate if:
|
| CPUUtilization |
The percentage of CPU being used by a task across multiple cores. The semantics of task CPUUtilization is slightly different from replication CPUUtilizaiton. If 1 vCPU is fully used, it indicates 100%, but if multiple vCPUs are in use, the value could be above 100%. Units: Percent |
| SwapUsage |
The amount of swap used by the task. Units: Bytes |
| MemoryUsage |
The control group (cgroup) memory.usage_in_bytes consumed by a task. DMS uses cgroups to control the usage of system resources such as memory and CPU. This metric indicates a task's memory usage in Megabytes within the cgroup allocated for that task. The cgroup limits are based on the resources available for your DMS replication instance class. memory.usage_in_bytes consists of resident set size (RSS), cache, and swap components of memory. The operating system can reclaim cache memory if needed. We recommend that you also monitor the replication instance metric, AvailableMemory. AWS DMS raises this metric against the combined dimensions of |
Viewing and managing AWS DMS task logs
You can use Amazon CloudWatch to log task information during an AWS DMS migration process. You enable logging when you select task settings. For more information, see Logging task settings.
To view logs of a task that ran, follow these steps:
-
Open the AWS DMS console, and choose Database migration tasks from the navigation pane. The Database migration tasks dialog appears.
-
Select the name of your task. The Overview details dialog appears.
-
Locate the Migration task logs section and choose View CloudWatch Logs.
In addition, you can use the AWS CLI or AWS DMS API to view information about task
logs. To do this, use the describe-replication-instance-task-logs AWS CLI
command or the AWS DMS API action DescribeReplicationInstanceTaskLogs.
For example, the following AWS CLI command shows the task log metadata in JSON format.
$ aws dms describe-replication-instance-task-logs \
   --replication-instance-arn arn:aws:dms:us-east-1:237565436:rep:CDSFSFSFFFSSUFCAY
A sample response from the command is as follows.
{
    "ReplicationInstanceTaskLogs": [
        {
            "ReplicationTaskArn": "arn:aws:dms:us-east-1:237565436:task:MY34U6Z4MSY52GRTIX3O4AY",
            "ReplicationTaskName": "mysql-to-ddb",
            "ReplicationInstanceTaskLogSize": 3726134
        }
    ],
    "ReplicationInstanceArn": "arn:aws:dms:us-east-1:237565436:rep:CDSFSFSFFFSSUFCAY"
}
In this response, there is a single task log (mysql-to-ddb) associated
with the replication instance. The size of this log is 3,726,124 bytes.
You can use the information returned by
describe-replication-instance-task-logs to diagnose and troubleshoot
problems with task logs. For example, if you enable detailed debug logging for a task,
the task log will grow quickly—potentially consuming all of the available storage
on the replication instance, and causing the instance status to change to
storage-full. By describing the task logs, you can determine which ones
you no longer need; then you can delete them, freeing up storage space.
To delete the task logs for a task, set the task setting DeleteTaskLogs
to true. For example, the following JSON deletes the task logs when modifying a task
using the AWS CLI modify-replication-task command or the AWS DMS API
ModifyReplicationTask action.
{
   "Logging": {
       "DeleteTaskLogs":true
   }
}
Logging AWS DMS API calls with AWS CloudTrail
AWS DMS is integrated with AWS CloudTrail, a service that provides a record of actions taken by a user, role, or an AWS service in AWS DMS. CloudTrail captures all API calls for AWS DMS as events, including calls from the AWS DMS console and from code calls to the AWS DMS API operations. If you create a trail, you can enable continuous delivery of CloudTrail events to an Amazon S3 bucket, including events for AWS DMS. If you don't configure a trail, you can still view the most recent events in the CloudTrail console in Event history. Using the information collected by CloudTrail, you can determine the request that was made to AWS DMS, the IP address from which the request was made, who made the request, when it was made, and additional details.
To learn more about CloudTrail, see the AWS CloudTrail User Guide.
AWS DMS information in CloudTrail
CloudTrail is enabled on your AWS account when you create the account. When activity occurs in AWS DMS, that activity is recorded in a CloudTrail event along with other AWS service events in Event history. You can view, search, and download recent events in your AWS account. For more information, see Viewing events with CloudTrail event history.
For an ongoing record of events in your AWS account, including events for AWS DMS, create a trail. A trail enables CloudTrail to deliver log files to an Amazon S3 bucket. By default, when you create a trail in the console, the trail applies to all AWS Regions. The trail logs events from all AWS Regions in the AWS partition and delivers the log files to the Amazon S3 bucket that you specify. Additionally, you can configure other AWS services to further analyze and act upon the event data collected in CloudTrail logs. For more information, see:
All AWS DMS actions are logged by CloudTrail and are documented in the AWS Database Migration Service API Reference. For
example, calls to the CreateReplicationInstance, TestConnection and
StartReplicationTask actions generate entries in the CloudTrail log files.
Every event or log entry contains information about who generated the request. The identity information helps you determine the following:
-
Whether the request was made with root or IAM user credentials.
-
Whether the request was made with temporary security credentials for a role or federated user.
-
Whether the request was made by another AWS service.
For more information, see the CloudTrail userIdentity element.
Understanding AWS DMS log file entries
A trail is a configuration that enables delivery of events as log files to an Amazon S3 bucket that you specify. CloudTrail log files contain one or more log entries. An event represents a single request from any source and includes information about the requested action, the date and time of the action, request parameters, and so on. CloudTrail log files are not an ordered stack trace of the public API calls, so they do not appear in any specific order.
The following example shows a CloudTrail log entry that demonstrates the RebootReplicationInstance action.
    {
    "eventVersion": "1.05",
    "userIdentity": {
        "type": "AssumedRole",
        "principalId": "AKIAIOSFODNN7EXAMPLE:johndoe",
        "arn": "arn:aws:sts::123456789012:assumed-role/admin/johndoe",
        "accountId": "123456789012",
        "accessKeyId": "ASIAYFI33SINADOJJEZW",
        "sessionContext": {
            "attributes": {
                "mfaAuthenticated": "false",
                "creationDate": "2018-08-01T16:42:09Z"
            },
            "sessionIssuer": {
                "type": "Role",
                "principalId": "AKIAIOSFODNN7EXAMPLE",
                "arn": "arn:aws:iam::123456789012:role/admin",
                "accountId": "123456789012",
                "userName": "admin"
            }
        }
    },
    "eventTime": "2018-08-02T00:11:44Z",
    "eventSource": "dms.amazonaws.com",
    "eventName": "RebootReplicationInstance",
    "awsRegion": "us-east-1",
    "sourceIPAddress": "72.21.198.64",
    "userAgent": "console.amazonaws.com",
    "requestParameters": {
        "forceFailover": false,
        "replicationInstanceArn": "arn:aws:dms:us-east-1:123456789012:rep:EX4MBJ2NMRDL3BMAYJOXUGYPUE"
    },
    "responseElements": {
        "replicationInstance": {
            "replicationInstanceIdentifier": "replication-instance-1",
            "replicationInstanceStatus": "rebooting",
            "allocatedStorage": 50,
            "replicationInstancePrivateIpAddresses": [
                "172.31.20.204"
            ],
            "instanceCreateTime": "Aug 1, 2018 11:56:21 PM",
            "autoMinorVersionUpgrade": true,
            "engineVersion": "2.4.3",
            "publiclyAccessible": true,
            "replicationInstanceClass": "dms.t2.medium",
            "availabilityZone": "us-east-1b",
            "kmsKeyId": "arn:aws:kms:us-east-1:123456789012:key/f7bc0f8e-1a3a-4ace-9faa-e8494fa3921a",
            "replicationSubnetGroup": {
                "vpcId": "vpc-1f6a9c6a",
                "subnetGroupStatus": "Complete",
                "replicationSubnetGroupArn": "arn:aws:dms:us-east-1:123456789012:subgrp:EDHRVRBAAAPONQAIYWP4NUW22M",
                "subnets": [
                    {
                        "subnetIdentifier": "subnet-cbfff283",
                        "subnetAvailabilityZone": {
                            "name": "us-east-1b"
                        },
                        "subnetStatus": "Active"
                    },
                    {
                        "subnetIdentifier": "subnet-d7c825e8",
                        "subnetAvailabilityZone": {
                            "name": "us-east-1e"
                        },
                        "subnetStatus": "Active"
                    },
                    {
                        "subnetIdentifier": "subnet-6746046b",
                        "subnetAvailabilityZone": {
                            "name": "us-east-1f"
                        },
                        "subnetStatus": "Active"
                    },
                    {
                        "subnetIdentifier": "subnet-bac383e0",
                        "subnetAvailabilityZone": {
                            "name": "us-east-1c"
                        },
                        "subnetStatus": "Active"
                    },
                    {
                        "subnetIdentifier": "subnet-42599426",
                        "subnetAvailabilityZone": {
                            "name": "us-east-1d"
                        },
                        "subnetStatus": "Active"
                    },
                    {
                        "subnetIdentifier": "subnet-da327bf6",
                        "subnetAvailabilityZone": {
                            "name": "us-east-1a"
                        },
                        "subnetStatus": "Active"
                    }
                ],
                "replicationSubnetGroupIdentifier": "default-vpc-1f6a9c6a",
                "replicationSubnetGroupDescription": "default group created by console for vpc id vpc-1f6a9c6a"
            },
            "replicationInstanceEniId": "eni-0d6db8c7137cb9844",
            "vpcSecurityGroups": [
                {
                    "vpcSecurityGroupId": "sg-f839b688",
                    "status": "active"
                }
            ],
            "pendingModifiedValues": {},
            "replicationInstancePublicIpAddresses": [
                "18.211.48.119"
            ],
            "replicationInstancePublicIpAddress": "18.211.48.119",
            "preferredMaintenanceWindow": "fri:22:44-fri:23:14",
            "replicationInstanceArn": "arn:aws:dms:us-east-1:123456789012:rep:EX4MBJ2NMRDL3BMAYJOXUGYPUE",
            "replicationInstanceEniIds": [
                "eni-0d6db8c7137cb9844"
            ],
            "multiAZ": false,
            "replicationInstancePrivateIpAddress": "172.31.20.204",
            "patchingPrecedence": 0
        }
    },
    "requestID": "a3c83c11-95e8-11e8-9d08-4b8f2b45bfd5",
    "eventID": "b3c4adb1-e34b-4744-bdeb-35528062a541",
    "eventType": "AwsApiCall",
    "recipientAccountId": "123456789012"
}
AWS DMS Context logging
AWS DMS uses context logging to give you information about a migration in progress. Context logging writes information, such as the following, to the task's CloudWatch log:
Information about the task's connection to the source and target databases.
Replication task behavior. You can use the task logs to diagnose replication issues.
SQL statements without data that AWS DMS executes on source and target databases. You can use the SQL logs to diagnose unexpected migration behavior.
Stream position details for each CDC event.
Context logging is only available in AWS DMS version 3.5.0 or higher.
AWS DMS turns on context logging by default. To control context logging, set the
EnableLogContext task setting to true or
false, or by modifying the task in the console.
AWS DMS writes context log information to the CloudWatch log's replication task every three minutes. Make sure that your replication instance has sufficient space for its application log. For more information about managing task logs, see Viewing and managing AWS DMS task logs.
Object Types
AWS DMS produces context logging in CloudWatch for the following object types.
| Object Type | Description |
|---|---|
TABLE_NAME |
These log entries contain information about tables that are in scope with the current task mapping rule. You can use these entries to examine the table events for a specific period during migration. |
SCHEMA_NAME |
These log entries contain information about schemas used by the current task mapping rule. You can use these entries to determine which schema AWS DMS is using for a specific period during migration. |
TRANSACTION_ID |
These entries contain the transaction ID for each DML/ DDL change captured from the source database. You can use these log entries to determine what changes happened during a given transaction. |
CONNECTION_ID |
These entries contain the connection ID. You can use these log entries to determine which connection AWS DMS uses for each migration step. |
STATEMENT |
These entries contain the SQL code used to fetch, process, and apply each migration change. |
STREAM_POSITION |
These entries contain the position in the transaction log file for each migration action on the source database. The format for these entries varies between source database engine types. You can also use this information to determine a starting position for a recovery checkpoint when configuring CDC-only replication. |
Logging Examples
This section contains examples of log records that you can use to monitor replication and diagnose replication issues.
Connection log examples
This section contains log samples that include connection IDs.
2023-02-22T10:09:29 [SOURCE_CAPTURE ]I: Capture record 1 to internal queue from Source {operation:START_REGULAR (43),connectionId:27598, streamPosition:0000124A/6800A778.NOW} (streamcomponent.c:2920) 2023-02-22T10:12:30 [SOURCE_CAPTURE ]I: Capture record 0 to internal queue from Source {operation:IDLE (51),connectionId:27598} (streamcomponent.c:2920) 2023-02-22T11:25:27 [SOURCE_CAPTURE ]I: Capture record 0 to internal queue from Source {operation:IDLE (51), columnName:region,connectionId:27598} (streamcomponent.c:2920)
Task behavior log examples
This section contains log samples about replication task log behavior. You can use this information to diagnose
replication issues, such as a task in the IDLE status.
The following SOURCE_CAPTURE logs indicate that there are no events available to read from the source
database log file, and contain TARGET_APPLY records that indicate that there are no events received from
AWS DMS CDC components to apply to the target database. These events also contain previously applied
event-related context details.
2023-02-22T11:23:24 [SOURCE_CAPTURE  ]I:  No Event fetched from wal log  (postgres_endpoint_wal_engine.c:1369)
2023-02-22T11:24:29 [TARGET_APPLY    ]I:  No records received to load or apply on target , waiting for data from upstream. The last context is  {operation:INSERT (1), tableName:sales_11, schemaName:public, txnId:18662441, connectionId:17855, statement:INSERT INTO "public"."sales_11"("sales_no","dept_name","sale_amount","sale_date","region") values (?,?,?,?,?),
SQL statement log examples
This section contains log samples about SQL statements run on source and target databases. The SQL statements
you see in the logs only show the SQL statement; they don't show the data. The following TARGET_APPLY
log shows an INSERT statement that ran on the target.
2023-02-22T11:26:07 [TARGET_APPLY ]I: Applied record 2193305 to target {operation:INSERT (1), tableName:sales_111, schemaName:public, txnId:18761543, connectionId:17855, statement:INSERT INTO "public"."sales_111"("sales_no","dept_name","sale_amount","sale_date","region") values (?,?,?,?,?),
Limitations
The following limitations apply to AWS DMS context logging:
While AWS DMS creates minimal logging for all endpoint types, extensive engine-specific context logging is only available for the following endpoint types. We recommend turning on context logging when using these endpoint types.
MySQL
PostgreSQL
Oracle
Microsoft SQL Server
MongoDB/ Amazon DocumentDB
Amazon S3
