Enhanced health monitoring with the environment management console
When you enable enhanced health reporting in AWS Elastic Beanstalk, you can monitor environment health in the environment management console.
Environment overview
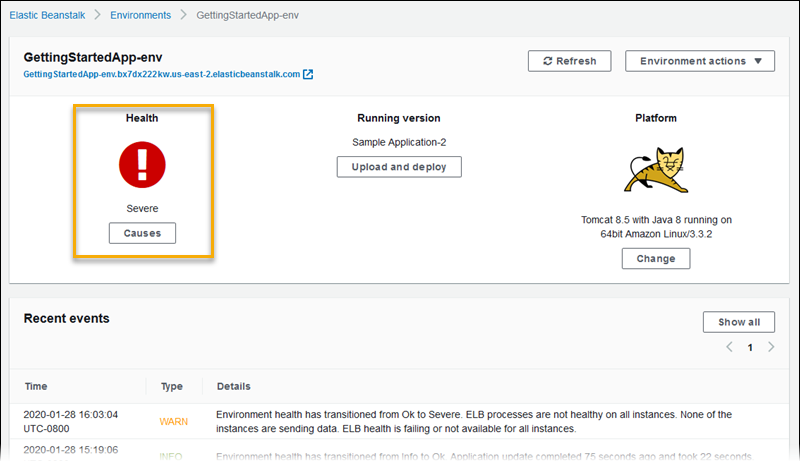
The environment overview displays the health status of the environment and lists events that provide information about recent changes in health status.
To view the environment overview
Open the Elastic Beanstalk console
, and in the Regions list, select your AWS Region. -
In the navigation pane, choose Environments, and then choose the name of your environment from the list.
Note
If you have many environments, use the search bar to filter the environment list.
For detailed information about the current environment's health, open the Health page by choosing Causes. Alternatively, in the navigation pane, choose Health.
Environment health page
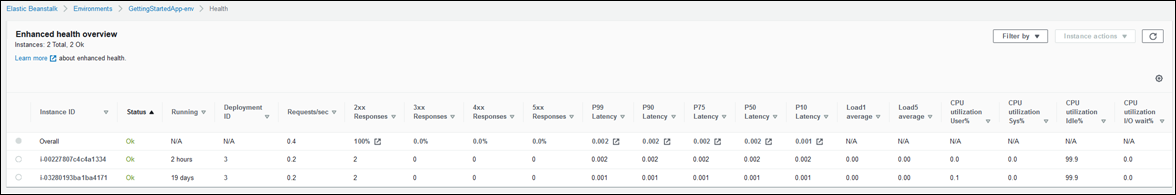
The Health page displays health status, metrics, and causes for the environment and for each Amazon EC2 instance in the environment.
Note
Elastic Beanstalk displays the Health page only if you have enabled enhanced health monitoring for the environment.
The following image shows the Health page for a Linux environment.
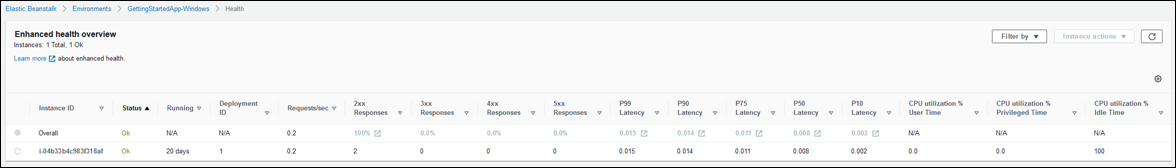
The following image shows the Health page for a Windows environment. Notice that CPU metrics are different from those on a Linux environment.
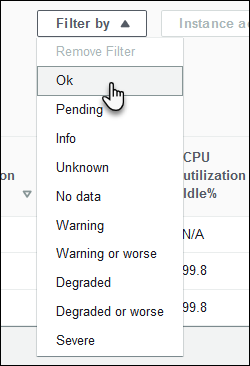
At the top of the page you can see the total number of environment instances, as well as the number of instances per status. To display only instances that have a particular status, chooseFilter By, and then select a status.
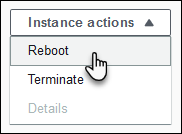
To reboot or terminate an unhealthy instance, choose Instance Actions, and then choose Reboot or Terminate.
Elastic Beanstalk updates the Health page every 10 seconds. It reports information about environment and instance health.
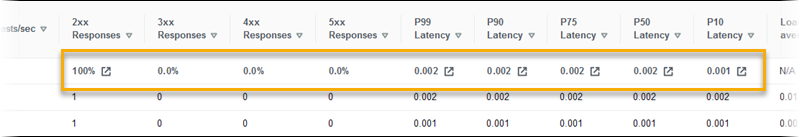
For each Amazon EC2 instance in the environment, the page displays the instance's ID and status, the amount of time since the instance was launched, the ID of the most recent deployment executed on the instance, the responses and latency of requests that the instance served, and load and CPU utilization information. The Overall row displays average response and latency information for the entire environment.
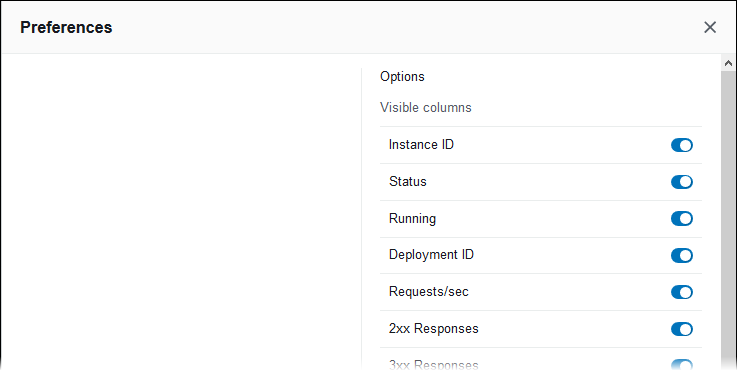
The page displays many details in a very wide table. To hide some of the columns, choose
 (Preferences). Select or clear column names, and then choose Confirm.
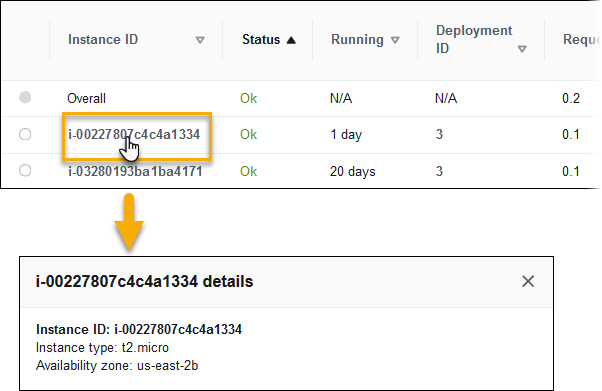
Choose the Instance ID of any instance to view more information about the instance, including its Availability Zone and instance type.
Choose the Deployment ID of any instance to view information about the last deployment to the instance.
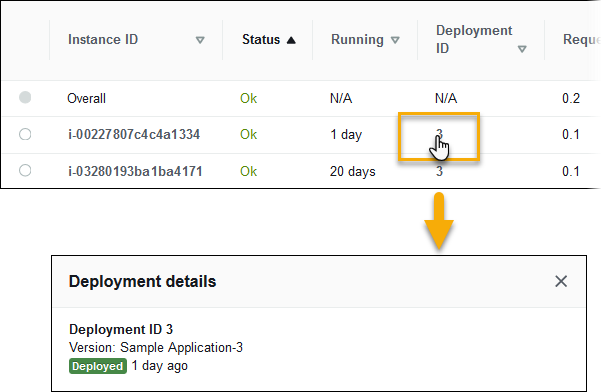
Deployment information includes the following:
-
Deployment ID—The unique identifier for the deployment. Deployment IDs starts at 1 and increase by one each time you deploy a new application version or change configuration settings that affect the software or operating system running on the instances in your environment.
-
Version—The version label of the application source code used in the deployment.
-
Status—The status of the deployment, which can be
In Progress,Deployed, orFailed. -
Time— For in-progress deployments, the time that the deployment started. For completed deployments, the time that the deployment ended.
If you enable X-Ray integration on your environment and instrument your application with the AWS X-Ray SDK, the Health page adds links to the AWS X-Ray console in the overview row.
Choose a link to view traces related to the highlighted statistic in the AWS X-Ray console.
Monitoring page
The Monitoring page displays summary statistics and graphs for the custom Amazon CloudWatch metrics generated by the enhanced health reporting system. See Monitoring environment health in the AWS management console for instructions on adding graphs and statistics to this page.
