We are no longer updating the Amazon Machine Learning service or accepting new users for it. This documentation is available for existing users, but we are no longer updating it. For more information, see What is Amazon Machine Learning.
Multiclass Model Insights
Interpreting the Predictions
The actual output of a multiclass classification algorithm is a set of prediction scores. The scores indicate the model's certainty that the given observation belongs to each of the classes. Unlike for binary classification problems, you do not need to choose a score cut-off to make predictions. The predicted answer is the class (for example, label) with the highest predicted score.
Measuring ML Model Accuracy
Typical metrics used in multiclass are the same as the metrics used in the binary classification case after averaging them over all classes. In Amazon ML, the macro-average F1 score is used to evaluate the predictive accuracy of a multiclass metric.
Macro Average F1 Score
F1 score is a binary classification metric that considers both binary metrics precision and recall. It is the harmonic mean between precision and recall. The range is 0 to 1. A larger value indicates better predictive accuracy:

The macro average F1 score is the unweighted average of the F1-score over all the classes in the multiclass case. It does not take into account the frequency of occurrence of the classes in the evaluation dataset. A larger value indicates better predictive accuracy. The following example shows K classes in the evaluation datasource:

Baseline Macro Average F1 Score
Amazon ML provides a baseline metric for multiclass models. It is the macro average F1 score for a hypothetical multiclass model that would always predict the most frequent class as the answer. For example, if you were predicting the genre of a movie and the most common genre in your training data was Romance, then the baseline model would always predict the genre as Romance. You would compare your ML model against this baseline to validate if your ML model is better than an ML model that predicts this constant answer.
Using the Performance Visualization
Amazon ML provides a confusion matrix as a way to visualize the accuracy of multiclass classification predictive models. The confusion matrix illustrates in a table the number or percentage of correct and incorrect predictions for each class by comparing an observation's predicted class and its true class.
For example, if you are trying to classify a movie into a genre, the predictive model might predict that its genre (class) is Romance. However, its true genre actually might be Thriller. When you evaluate the accuracy of a multiclass classification ML model, Amazon ML identifies these misclassifications and displays the results in the confusion matrix, as shown in the following illustration.
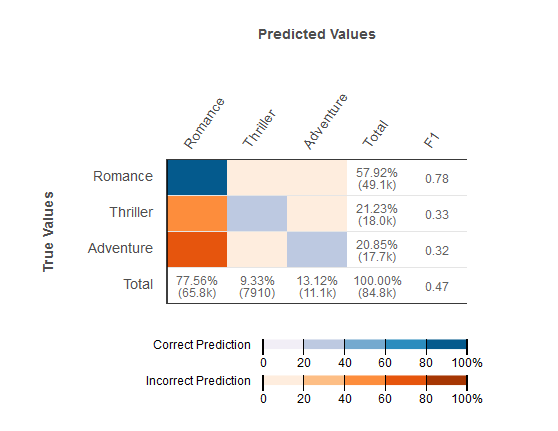
The following information is displayed in a confusion matrix:
-
Number of correct and incorrect predictions for each class: Each row in the confusion matrix corresponds to the metrics for one of the true classes. For example, the first row shows that for movies that are actually in the Romance genre, the multiclass ML model gets the predictions right for over 80% of the cases. It incorrectly predicts the genre as Thriller for less than 20% of the cases, and Adventure for less than 20% of the cases.
-
Class-wise F1-score: The last column shows the F1-score for each of the classes.
-
True class-frequencies in the evaluation data: The second to last column shows that in the evaluation dataset, 57.92% of the observations in the evaluation data is Romance, 21.23% is Thriller, and 20.85% is Adventure.
-
Predicted class-frequencies for the evaluation data: The last row shows the frequency of each class in the predictions. 77.56% of the observations is predicted as Romance, 9.33% is predicted as Thriller, and 13.12% is predicted as Adventure.
The Amazon ML console provides a visual display that accommodates up to 10 classes in the confusion matrix, listed in order of most frequent to least frequent class in the evaluation data. If your evaluation data has more than 10 classes, you will see the top 9 most frequently occurring classes in the confusion matrix, and all other classes will be collapsed into a class called "others." Amazon ML also provides the ability to download the full confusion matrix through a link on the multiclass visualizations page.
