Agent details - Sessions
An Agent can have several Sessions. View session in the Sessions tab. Use the Filter sessions or sort the columns to find the required session.
Choose the Session ID to view the session summary metrics and the list of traces belonging to that session. Session metrics include:
-
Traces – Number of traces belonging to the sessions
-
Server errors – Count of system errors during request processing. High levels of server-side errors can indicate potential infrastructure or service issues that require investigation
-
Client errors – Client errors are errors resulting from invalid requests. High levels of client-side errors can indicate issues with request formatting or permissions
-
Throttles – Number of requests throttled relevant to this session due to exceeding allowed TPS (Transactions Per Second)
-
Sessions details – Meta data about the session such as start time, end time, and session ID
To analyze a list of Traces in a session, choose Filter traces to narrow down or sort the table columns to bubble up the particular Trace you want to investigate.
After you select a Trace, the right-pane displays the details of the Trace. For each Trace, you can see the Trace summary, Spans, and Trace content details.
Under Trace summary, you can view the following metrics:
Note
Summary page fields are consistent across Agent view, Sessions view, and Traces view.
-
Spans – Number of spans within a Trace
-
Server errors – Count of system errors during request processing. High levels of server-side errors can indicate potential infrastructure or service issues that require investigation
-
Client errors – Client errors are errors resulting from invalid requests. High levels of client-side errors can indicate issues with request formatting or permissions
-
Throttles – Number of requests throttle relevant to this session due to exceeding allowed TPS (Transactions Per Second)
-
P95 span latency – The 95-percentile latency of across all invocation of this particular span. Note that a span can be used across many agents
-
Trace details – Meta data about the trace such as start time, end time, and Trace ID
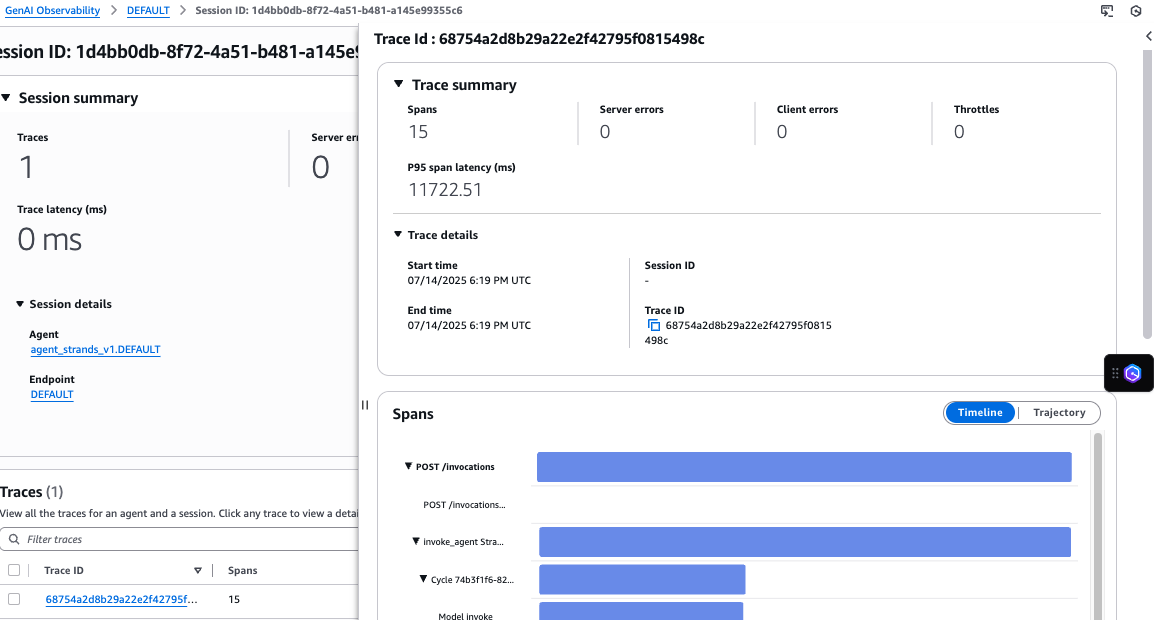
Choose Timeline to view the duration of each span and to understand the span that took the longest and contributed to a slow response.
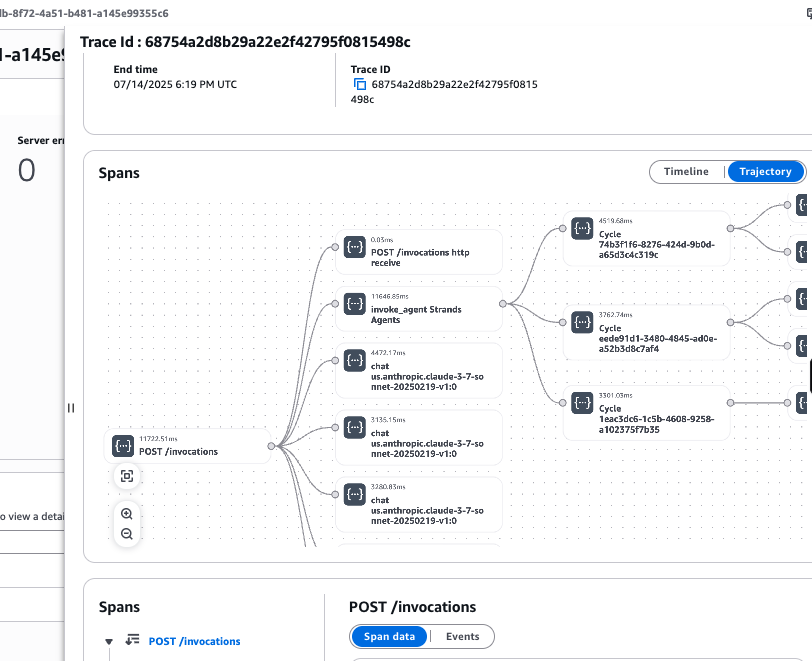
To analyze span relationships and subsequent calls choose Trajectory to understand the interconnected relationship of the spans and subsequent calls from these spans.
Under Spans, select an individual span event to review the span data in its original form. Review the span data in its original form. For granular troubleshooting, select the Events tab to examine model inputs and outputs.
