Analyzing DB load by wait events
If the Database load chart shows a bottleneck, you can find out where the load is coming from. To do so, look at the top load items table below the Database load chart. Choose a particular item, like a SQL query or a user, to drill down into that item and see details about it.
DB load grouped by waits and top SQL queries is the default Performance Insights dashboard view. This combination typically provides the most insight into performance issues. DB load grouped by waits shows if there are any resource or concurrency bottlenecks in the database. In this case, the SQL tab of the top load items table shows which queries are driving that load.
Your typical workflow for diagnosing performance issues is as follows:
-
Review the Database load chart and see if there are any incidents of database load exceeding the Max CPU line.
-
If there is, look at the Database load chart and identify which wait state or states are primarily responsible.
-
Identify the digest queries causing the load by seeing which of the queries the SQL tab on the top load items table are contributing most to those wait states. You can identify these by the DB Load by Wait column.
-
Choose one of these digest queries in the SQL tab to expand it and see the child queries that it is composed of.
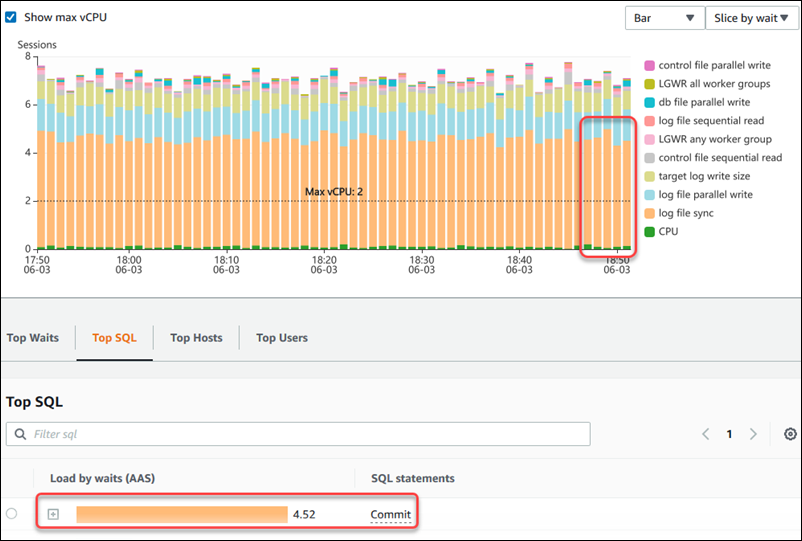
For example, in the dashboard following, log file sync waits account for most of the DB load.
The LGWR all worker groups wait is also high. The Top SQL chart shows
what is causing the log file sync waits: frequent COMMIT statements. In this
case, committing less frequently will reduce DB load.