Monitor Athena query metrics with CloudWatch
Athena publishes query-related metrics to Amazon CloudWatch, when the publish query metrics to CloudWatch option is selected. You can create custom dashboards, set alarms and triggers on metrics in CloudWatch, or use pre-populated dashboards directly from the Athena console.
When you enable query metrics for queries in workgroups, the metrics are displayed within the Metrics tab in the Workgroups panel, for each workgroup in the Athena console.
Athena publishes the following metrics to the CloudWatch console:
-
DPUAllocated– The total number of DPUs (data processing units) provisioned in a capacity reservation to run queries. -
DPUConsumed– The number of DPUs actively consumed by queries in aRUNNINGstate at a given time in a reservation. Metric emitted only when workgroup is associated with a capacity reservation and includes all workgroups associated with a reservation. -
DPUCount– The maximum number of DPUs consumed by your query, published exactly once as the query completes. -
EngineExecutionTime– The number of milliseconds that the query took to run. -
ProcessedBytes– The number of bytes that Athena scanned per DML query. -
QueryPlanningTime– The number of milliseconds that Athena took to plan the query processing flow. -
QueryQueueTime– The number of milliseconds that the query was in the query queue waiting for resources. -
ServicePreProcessingTime– The number of milliseconds that Athena took to preprocess the query before submitting the query to the query engine. -
ServiceProcessingTime– The number of milliseconds that Athena took to process the query results after the query engine finished running the query. -
TotalExecutionTime– The number of milliseconds that Athena took to run a DDL or DML query.
For more complete descriptions, see the List of CloudWatch metrics and dimensions for Athena later in this document.
These metrics have the following dimensions:
-
CapacityReservation– The name of the capacity reservation used to execute the query, if applicable. -
QueryState–SUCCEEDED,FAILED, orCANCELED -
QueryType–DML,DDL, orUTILITY -
WorkGroup– name of the workgroup
Athena publishes the following metric to the CloudWatch console under the
AmazonAthenaForApacheSpark namespace:
-
DPUCount– number of DPUs consumed during the session to execute the calculations.
This metric has the following dimensions:
-
SessionId– The ID of the session in which the calculations are submitted. -
WorkGroup– Name of the workgroup.
For more information, see the List of CloudWatch metrics and dimensions for Athena later in this topic. For information about Athena usage metrics, see Monitor Athena usage metrics with CloudWatch.
You can view query metrics in the Athena console or in the CloudWatch console.
To view query metrics for a workgroup in the Athena console
Open the Athena console at https://console.aws.amazon.com/athena/
. If the console navigation pane is not visible, choose the expansion menu on the left.

-
In the navigation pane, choose Workgroups.
-
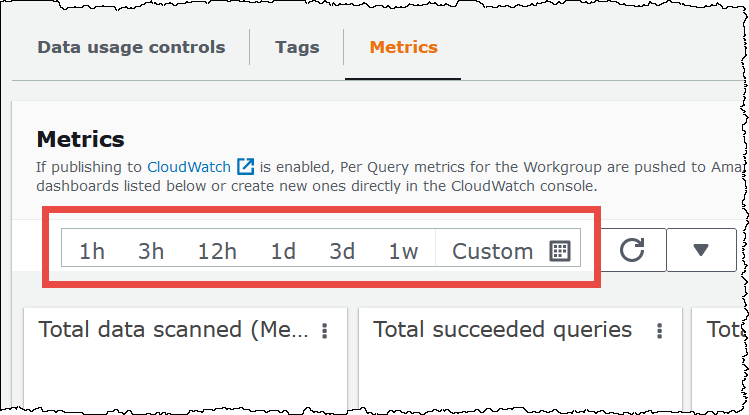
Choose the workgroup that you want from the list, and then choose the Metrics tab.
The metrics dashboard displays.
Note
If you just recently enabled metrics for the workgroup and/or there has been no recent query activity, the graphs on the dashboard may be empty. Query activity is retrieved from CloudWatch depending on the interval that you specify in the next step.
-
In the Metrics section, choose the metrics interval that Athena should use to fetch the query metrics from CloudWatch, or specify a custom interval.
-
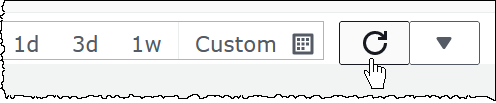
To refresh the displayed metrics, choose the refresh icon.
-
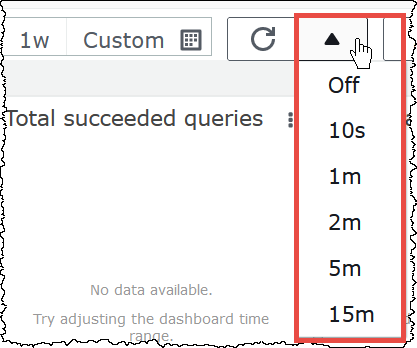
Click the arrow next to the refresh icon to choose how frequently you want the metrics display to be updated.
To view metrics in the Amazon CloudWatch console
Open the CloudWatch console at https://console.aws.amazon.com/cloudwatch/
. -
In the navigation pane, choose Metrics, All metrics.
-
Select the AWS/Athena namespace.
To view metrics with the AWS CLI
-
Do one of the following:
-
To list the metrics for Athena, open a command prompt, and use the following command:
aws cloudwatch list-metrics --namespace "AWS/Athena" -
To list all available metrics, use the following command:
aws cloudwatch list-metrics"
-
If you've enabled CloudWatch metrics in Athena, it sends the following metrics to CloudWatch per
workgroup. The following metrics use the AWS/Athena namespace.
| Metric name | Description |
|---|---|
| DPUAllocated |
The total number of DPUs (data processing units) provisioned in a capacity reservation to run queries. |
| DPUConsumed | The number of DPUs actively consumed by queries in a
RUNNING state at a given time in a reservation. This
metric is emitted only when workgroup is associated with a capacity
reservation and includes all workgroups associated with a reservation.
If you move a workgroup from one reservation to another, the metric
includes data from the time when the workgroup belonged to the first
reservation. For more information about capacity reservations, see Manage query processing capacity. |
| DPUCount | The maximum number of DPUs consumed by your query, published exactly once as the query completes. This metric is emitted only for workgroups that are attached to a capacity reservation. |
| EngineExecutionTime |
The number of milliseconds that the query took to run. |
| ProcessedBytes |
The number of bytes that Athena scanned per DML query. For queries that were canceled (either by the users, or automatically, if they reached the limit), this includes the amount of data scanned before the cancellation time. This metric is not reported for DDL queries. |
| QueryPlanningTime | The number of milliseconds that Athena took to plan the query processing flow. This includes the time spent retrieving table partitions from the data source. Note that because the query engine performs the query planning, query planning time is a subset of EngineExecutionTime. |
| QueryQueueTime | The number of milliseconds that the query was in the query queue waiting for resources. Note that if transient errors occur, the query can be automatically added back to the queue. |
| ServicePreProcessingTime | The number of milliseconds that Athena took to preprocess the query before submitting the query to the query engine. |
| ServiceProcessingTime | The number of milliseconds that Athena took to process the query results after the query engine finished running the query. |
| TotalExecutionTime | The number of milliseconds that Athena took to run a DDL or DML query. TotalExecutionTime includes QueryQueueTime, QueryPlanningTime, EngineExecutionTime, and ServiceProcessingTime. |
These metrics for Athena have the following dimensions.
| Dimension | Description |
|---|---|
| CapacityReservation |
The name of the capacity reservation that was used to execute the query, if applicable. When a capacity reservation is not used, this dimension returns no data. |
| QueryState |
The query state. Valid statistics: SUCCEEDED, FAILED, or CANCELED. |
| QueryType |
The query type. Valid statistics: |
| WorkGroup |
The name of the workgroup. |
