Use pre-filtered tables for Routing profiles and Queues tables in Amazon Connect
In real-time metrics reports, for Routing profiles and Queues tables, you can open pre-filtered tables that display the associated queues, routing profiles, or agents. These one-click filters provide a way for you to drill into the performance data.
Example 1: Queues table -> Routing profiles table -> Agents table
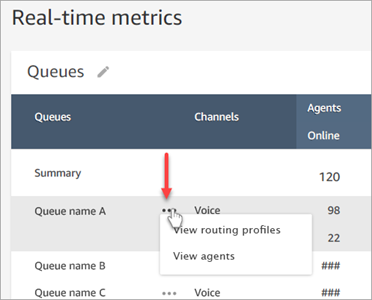
For example, at a Queues table, choose the dropdown and then choose View routing profiles, as shown in the following image.

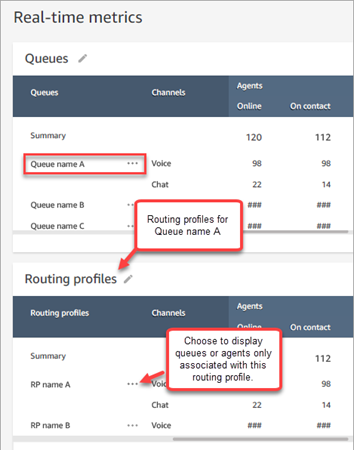
Below the Queues table, a Routing profiles table appears, as shown in the following image. It is filtered to display only the routing profiles associated with the queue. On the Routing profiles table, you can choose quick filters to display queues or agents only associated with that routing profile.

Example 2: Queues table -> Agents table
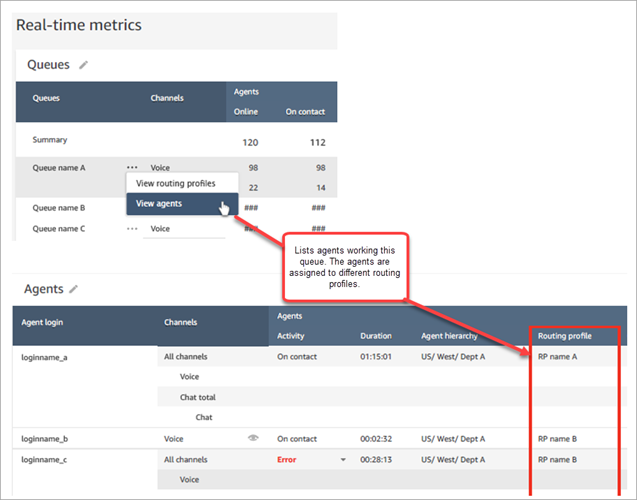
At the Queues table, choose View agents. Below the Queues table, an Agents table appears. It is filtered to display all the agents working that queue, as shown in the following image. The agents may be associated with different routing profiles.

Example 3: Queues table -> Steps table
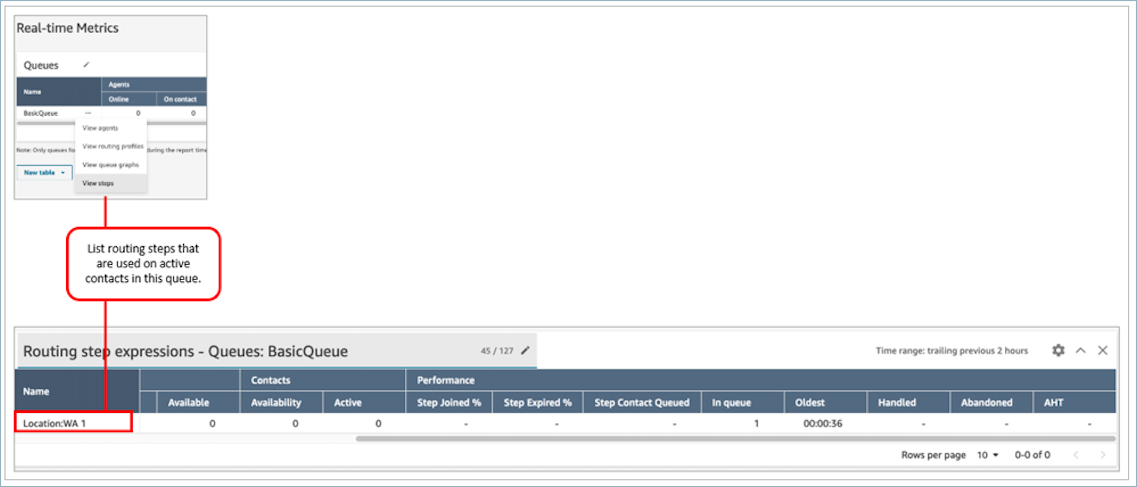
At the Queues table, choose View Steps. Below the Queues table, a Steps table appears. It is filtered to display all the routing steps that are being used on active contacts in that queue, as shown in the following image.
