Queue and agent performance dashboard in Amazon Connect
The Queue and agent performance dashboard helps you understand the performance of your queues and agents compared over configurable periods of time. It uses key metrics such as contacts handled, service level, and average handle time.
This dashboard includes:
-
Real-time statistics such as number of agents online and current agent activity. It has the capabilities and metrics that are available on the Real-time metrics page.
-
Customer first callback mode metrics. These metrics are only available on the dashboard and by calling the GetMetricDataV2 API. They're not available on the Historical metrics report.
Contents
Enable access to the dashboard
Ensure users are assigned the appropriate security profile permissions:
-
Access metrics - Access permission or the Dashboard - Access permission. For information about the difference in behavior, see Assign permissions to view dashboards and reports in Amazon Connect.
Performance overview chart
The Performance overview chart that provides aggregated metrics based on your filters. Each metric within the chart is compared to your "compare to" benchmark time range filter.
The following image shows an example Performance overview chart:

-
Contacts handled during your time range selection was 126,306, which is down ~13% compared to your benchmark number of contacts handled, 144,647 contacts.
-
The percentages are rounded up or down.
-
The colors that appear for the metrics indicate positive (green) or negative (red) compared to your benchmark.
-
There are no colors for Contacts handled.
Current queue overview
The Current queue overview widget provides real-time snapshot metrics that display what is happening right now in your queues. You can configure this widget in multiple ways including changing the metrics (but only to real-time queue metrics), configuring the queues that are included, and re-ordering the metrics.
The following image shows an example Current queue overview.

Current agent performance
The Current agent performance widget provides a real-time view of what agents are doing (equivalent to the real-time metrics page agent widget) including time in status, current active contacts, and the next activity.
By default, this widget collapses the rows to give you an at a glance view of what agents are doing. Choose Expand all to automatically expand all the rows for a complete view of agent performance.
With the appropriate security profile permissions, from this widget you can listen in to contacts and change agent statuses within this widget (similar to the real-time metrics page).
Note
You can't change the grouping of this widget.
The following image shows an example Current agent performance.

Thresholds
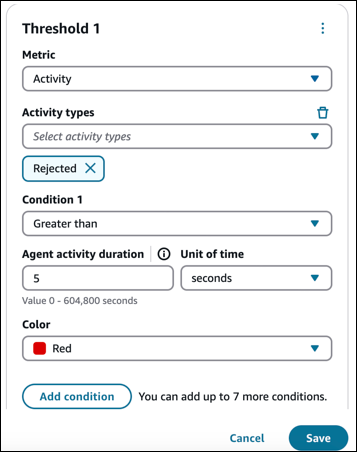
You can also set thresholds on this widget, but several of the metrics behave slightly differently. For agent activity you need to select two conditions:
-
What the activity type is (for example, rejected)
-
The duration of that activity
You configure custom thresholds based on the state. For example, you can define a cell that should flip to red if an agent is in missed call state for more than 5 seconds but also only flip to red if an agent is on hold for more than 5 minutes.
The following image shows an example of thresholds set on the Activity metric.
Contact state filtering
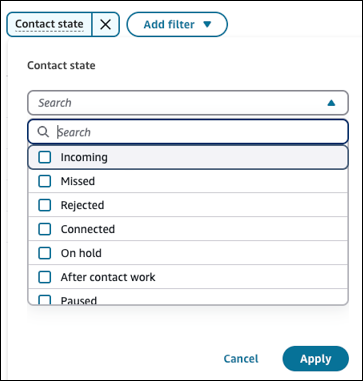
You can filter by contact states to identify specific agents who have a contact within a specific state. For example, if you want to quickly identify agents who have a contact in error and can’t be routed additional contacts, you can filter for "Missed" and "Rejected" to identify those agents and change their status.
The following image shows a list of some of the filters available for contact states.
Agent adherence
The Agent adherence widget provides a real-time view of agent adherence metrics, including adherence status, duration, and percentage, enabling supervisors to monitor and manage agent adherence. This widget supports filtering on adherence status, duration, and percentage, sorting by duration or percentage, and conditional formatting on duration and percentage to quickly identify adherence breaches and take prompt action to address issues.
For example, you can filter for agents with a Non-adherent status, sort by adherence duration, and highlight duration greater than 5 minutes to quickly identify breaches and send reminders to bring agents back on task.
The following image shows an example of the Agent adherence widget. The red highlight is conditional formatting applied on the Adherence status duration (Adherence status duration >= 3 hours). The breach in the agent adherence is indicated by the Non-adherent status.

The following image shows an example of how to set up conditional formatting.

The following image shows an example of filtering the Adherence status duration. In this case, Amazon Connect will display only those agents who are not adherent for longer than 10 minutes.

Trailing agent performance
This table provides a historical view of performance over time.

To see how your performance compares to the previous time range, choose Actions, Edit. On the Edit pane, choose Show comparison, as shown in the following image.

You can also change the metrics, configure thresholds, or re-order metrics.
Average queue answer time and contacts queued trend
The Average queue answer time and contacts queued trend is a time-series chart that displays the count of contacts queued (blue bars) and the average queue answer time (red line) over a given time period broken down by intervals (15min, daily, weekly, monthly). You can also change the metrics and add up to four different metrics as line graphs.
Note
This widget can support a maximum of two metric types (count, time, percentage).
The following image shows the Contacts queued (blue bars) and Avg queue answer time (red line), for four months.

This next image shows the same data, but with the addition of the Contacts abandoned (green) filter.

Contacts handled and average handle time trend
The Contacts handled and average handle time trend is a time-series chart that displays the count of contacts handled (blue bars) and the average handle time (red line) over a given time period broken down by intervals (15min, daily, weekly, monthly).
To configure different time range intervals, choose Interval, as shown in the following image.

The available intervals depend on the page-level time range filter, which is set at the top of the page. For example:
-
If you have a "Today" time range filter at the top of your dashboard, you can only see an interval of 15min for the last 24 hours.
-
If you have a "Day" time range filter at the top of your dashboard, you can see a trailing 8 day interval trend, or a 15min interval trend for the trailing 24 hours.
Agent status drill down
The Agent status drill down widget displays the number of agents logged into the Contact Control Panel (CCP), and their status. By default, the widget groups data by queue. For more detail, you can add Agent status as a secondary grouping to view agent count by their CCP status within each queue.
The following image shows an example of the Agent status drill down widget. It shows Agent status (for example, Training, Lunch) as a secondary grouping.

Dashboard functionality limitations
The following limitations apply to the Queue performance dashboard:
-
Tag-based access controls are not supported on the dashboard.
