Using latency histograms
When you select a node or edge on an AWS X-Ray trace map, the X-Ray console shows a latency distribution histogram.
Latency
Latency is the amount of time between when a request starts and when it completes. A histogram shows a distribution of latencies. It shows duration on the x-axis, and the percentage of requests that match each duration on the y-axis.
This histogram shows a service that completes most requests in less than 300 ms. A small percentage of requests take up to 2 seconds, and a few outliers take more time.

Interpreting service details
Service histograms and edge histograms provide a visual representation of latency from the viewpoint of a service or requester.
-
Choose a service node by clicking the circle. X-Ray shows a histogram for requests served by the service. The latencies are those recorded by the service, and don't include any network latency between the service and the requester.
-
Choose an edge by clicking the line or arrow tip of the edge between two services. X-Ray shows a histogram for requests from the requester that were served by the downstream service. The latencies are those recorded by the requester, and include latency in the network connection between the two services.
To interpret the Service details panel histogram, you can look for values that differ the most from the majority of values in the histogram. These outliers can be seen as peaks or spikes in the histogram, and you can view the traces for a specific area to investigate what's going on.
To view traces filtered by latency, select a range on the histogram. Click where you want to start the selection and drag from left to right to highlight a range of latencies to include in the trace filter.
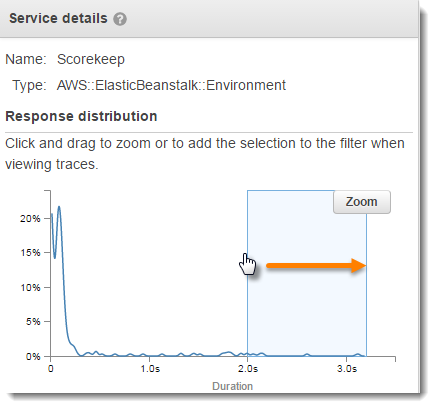
After selecting a range, you can choose Zoom to view just that portion of the histogram and refine your selection.

Once you have the focus set to the area you're interested in, choose View traces.
