Viewing and interacting with Detective profile panels
Each entity profile on the Amazon Detective console consists of a set of profile panels. A profile panel is a visualization that provides general details or highlights specific activity associated with an entity. Profile panels use different types of visualizations to present different types of information. They can also provide links to additional details or to other profiles.
Each profile panel is intended to help analysts find answers to specific questions about entities and their associated activity. The answers to those questions help lead to a conclusion about whether the activity represents a genuine threat.
Profile panels use different types of visualizations to present different types of information.
Types of information on a profile panel
Profile panels typically provide the following types of data.
|
Panel data type |
Description |
|---|---|
|
High-level information about a finding or entity |
The simplest type of panel provides some basic information about an entity. Examples of information included on an information panel include the identifier, name, type, and creation date. 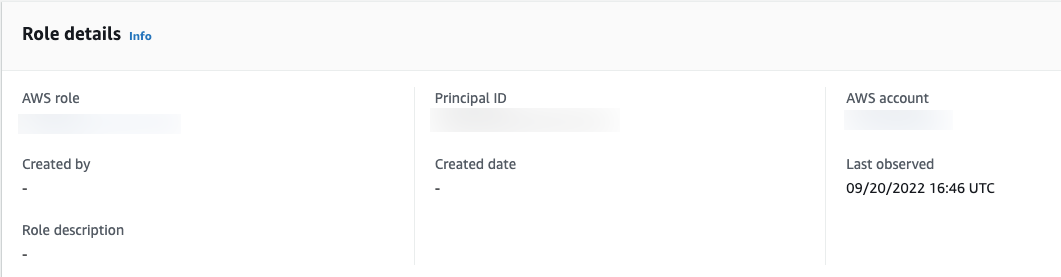
Most entity profiles contain an information panel for that entity. |
|
General summary of activity over time |
Displays a summary of activity for an entity over time. This type of panel provides an overall view of how an entity is behaving during the scope time. 
Here are some examples of summary data provided on Detective profile panels:
|
|
Summary of activity grouped by values |
Displays a summary of activity for an entity, grouped by specific values. You can see this type of profile panel on the profile for an EC2 instance. The profile panel shows the average volume of VPC flow log data to and from an EC2 instance for common ports that are associated with specific types of services. 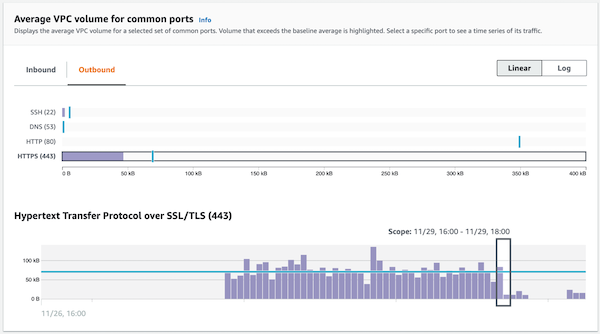
|
|
Activity that only started during the scope time |
During an investigation, it is valuable to see what activity only began to occur during a specific time frame. For example, are there API calls, geographic locations, or user agents that were not seen before? 
If the behavior graph is still in training mode, the profile panel displays a notification message. The message is removed when the behavior graph has accumulated at least two weeks of data. For more information about training mode, see Training period for new Detective behavior graphs. |
|
Activity that changed significantly during the scope time |
Similar to the new activity panels, profile panels can also display activity that changed significantly during the scope time. For example, a user might regularly issue a certain API call a few times a week. If the same user suddenly issues the same call multiple times in a single day, that might be evidence of malicious activity. 
If the behavior graph is still in training mode, the profile panel displays a notification message. The message is removed when the behavior graph has accumulated at least two weeks of data. For more information about training mode, see Training period for new Detective behavior graphs. |
