Overview of the Top queries tab
By default, the Top query tab shows the queries that are contributing the most to DB load. You can analyze the query text to help tune your queries.
Topics
Query digests
A query digest is a composite of multiple actual queries that are structurally similar but might have different literal values. The digest replaces hardcoded values with a question mark. For example, a query digest might look like this:
{"find":"customerscollection","filter":{"FirstName":"?"},"sort":{"key":{"$numberInt":"?"}},"limit":{"$numberInt":"?"}}
This digest might include the following child queries:
{"find":"customerscollection","filter":{"FirstName":"Karrie"},"sort":{"key":{"$numberInt":"1"}},"limit":{"$numberInt":"3"}}
{"find":"customerscollection","filter":{"FirstName":"Met"},"sort":{"key":{"$numberInt":"1"}},"limit":{"$numberInt":"3"}}
{"find":"customerscollection","filter":{"FirstName":"Rashin"},"sort":{"key":{"$numberInt":"1"}},"limit":{"$numberInt":"3"}}
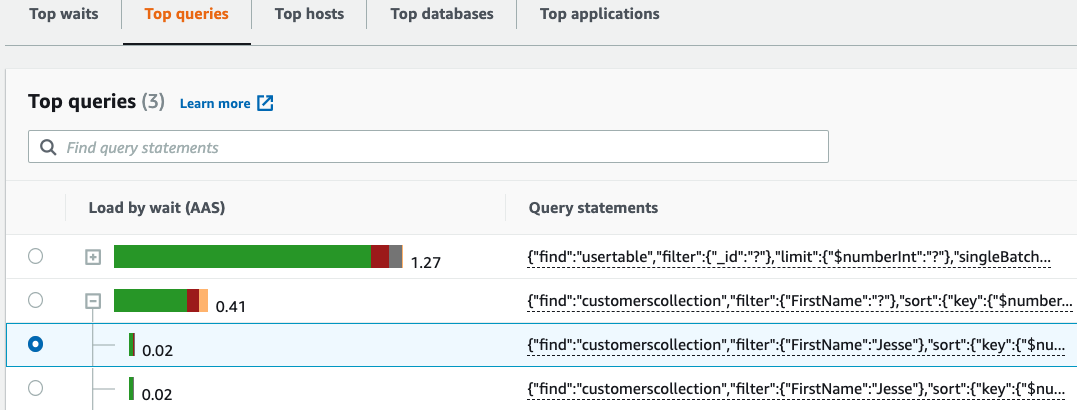
To see the literal query statements in a digest, select the query, and then
choose the plus symbol (+). In the following screenshot, the
selected query is a digest.
Note
A query digest groups similar query statements, but does not redact sensitive information.
Load by waits (AAS)
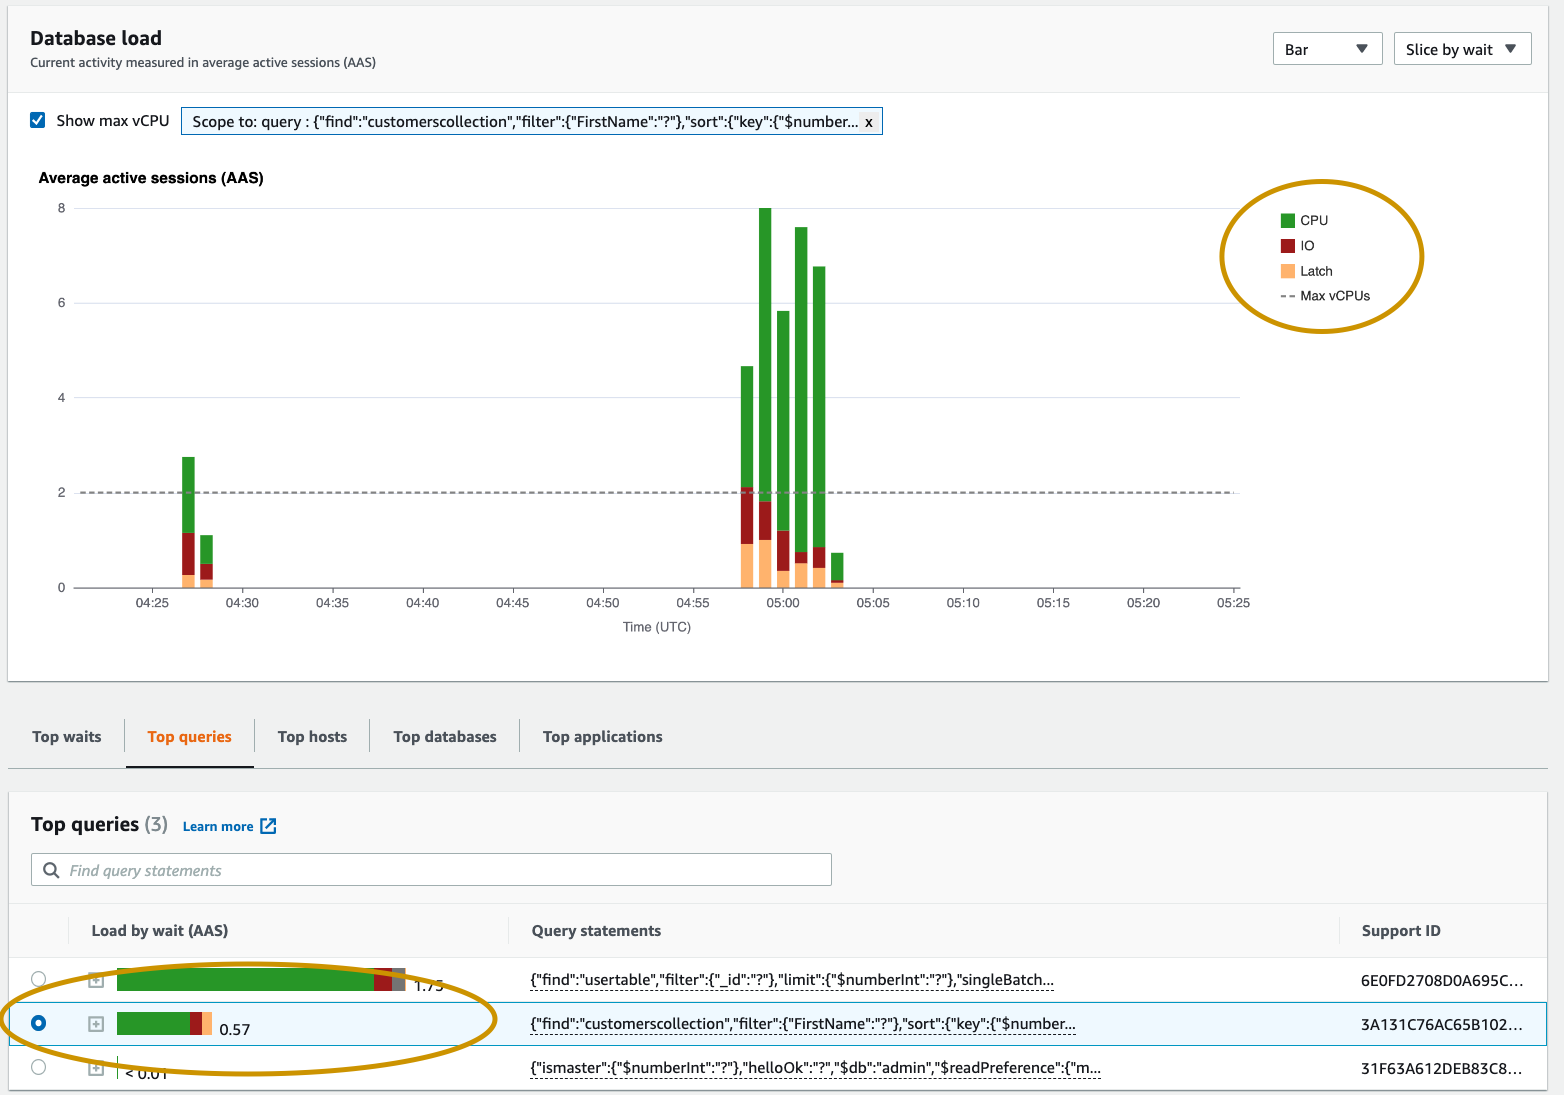
In Top queries, the Load by waits (AAS) column illustrates the percentage of the database load associated with each top load item. This column reflects the load for that item by whatever grouping is currently selected in the DB load chart. For example, you might group the DB load chart by wait states. In this case, the DB Load by Waits bar is sized, segmented, and color-coded to show how much of a given wait state that query is contributing to. It also shows which wait states are affecting the selected query.
Viewing detailed query information
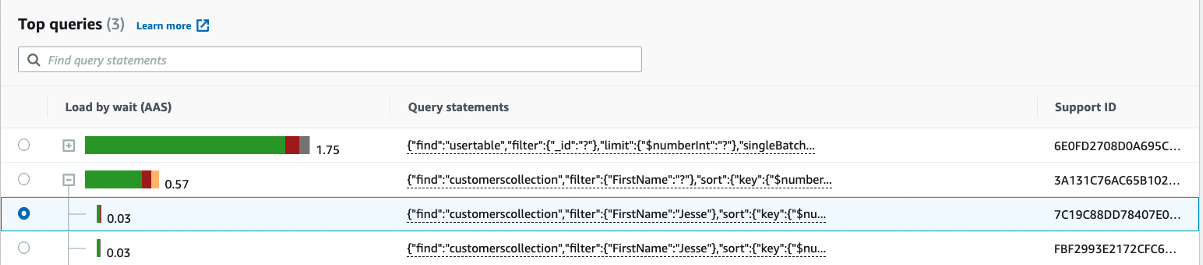
In the Top query table, you can open a digest statement to view its information. The information appears in the bottom pane.

The following types of identifiers (IDs) are associated with query statements:
-
Support query ID – A hash value of the query ID. This value is only for referencing a query ID when you are working with AWS Support. AWS Support doesn't have access to your actual query IDs and query text.
-
Support digest ID – A hash value of the digest ID. This value is only for referencing a digest ID when you are working with AWS Support. AWS Support doesn't have access to your actual digest IDs and query text.
Accessing statement query text
By default, each row in the Top queries table shows 500 bytes of query text for each query statement. When a digest statement exceeds 500 bytes, you can view more text by opening the statement in the Performance Insights dashboard. In this case, the maximum length for the displayed query is 1 KB. If you view a full query statement, you can also choose Download.
Viewing and downloading statement query text
In the Performance Insights dashboard, you can view or download query text.
To view more query text in the Performance Insights dashboard
-
Open the Amazon DocumentDB console at: https://console.aws.amazon.com/docdb/
-
In the navigation pane, choose Performance Insights.
-
Choose a DB instance. The Performance Insights dashboard is displayed for that DB instance.
Query statements with text larger than 500 bytes will look like the following image:
-
Examine the query information section to view more of the query text.

The Performance Insights dashboard can display up to 1 KB for each full query statement.
Note
To copy or download the query statement, disable any pop-up blockers.
