Using OpenSearch Dashboards with Amazon OpenSearch Service
OpenSearch Dashboards is an open-source visualization tool designed to work with OpenSearch. Amazon OpenSearch Service provides an installation of Dashboards with every OpenSearch Service domain. Dashboards runs on the hot data nodes in the domain.
OpenSearch Dashboards is a visualization tool for exploring and analyzing data within a single OpenSearch domain. In contrast, the centralized OpenSearch user interface (also called an OpenSearch application) is a cloud-based UI that connects to multiple OpenSearch domains, OpenSearch Serverless collections, and AWS data sources. It includes workspaces for specific use cases like observability and security analytics, and provides a unified experience across data sets. While Dashboards is tied to individual domains, the centralized UI enables cross-domain data integration and analysis. For more information, see Using OpenSearch UI in Amazon OpenSearch Service.
You can find a link to OpenSearch Dashboards on your domain dashboard in the OpenSearch Service console. For
domains running OpenSearch, the URL is
domain-endpoint/_dashboards/domain-endpoint/_plugin/kibana
Queries using this default Dashboards installation have a 300-second timeout.
Note
This documentation discusses OpenSearch Dashboards in the context of Amazon OpenSearch Service, including
different ways to connect to it. For comprehensive documentation, including a getting
started guide, instruction to create a dashboard, dashboards management, and Dashboards
Query Language (DQL), see OpenSearch Dashboards
Controlling access to Dashboards
Dashboards does not natively support IAM users and roles, but OpenSearch Service offers several solutions for controlling access to Dashboards:
-
Use fine-grained access control with HTTP basic authentication.
-
Configure Cognito authentication for Dashboards.
-
For public access domains, configure an IP-based access policy that either uses or does not use a proxy server.
-
For VPC access domains, use an open access policy that either uses or does not use a proxy server, and security groups to control access. To learn more, see About access policies on VPC domains.
Using a proxy to access OpenSearch Service from Dashboards
Note
This process is only applicable if your domain uses public access and you don't want to use Cognito authentication. See Controlling access to Dashboards .
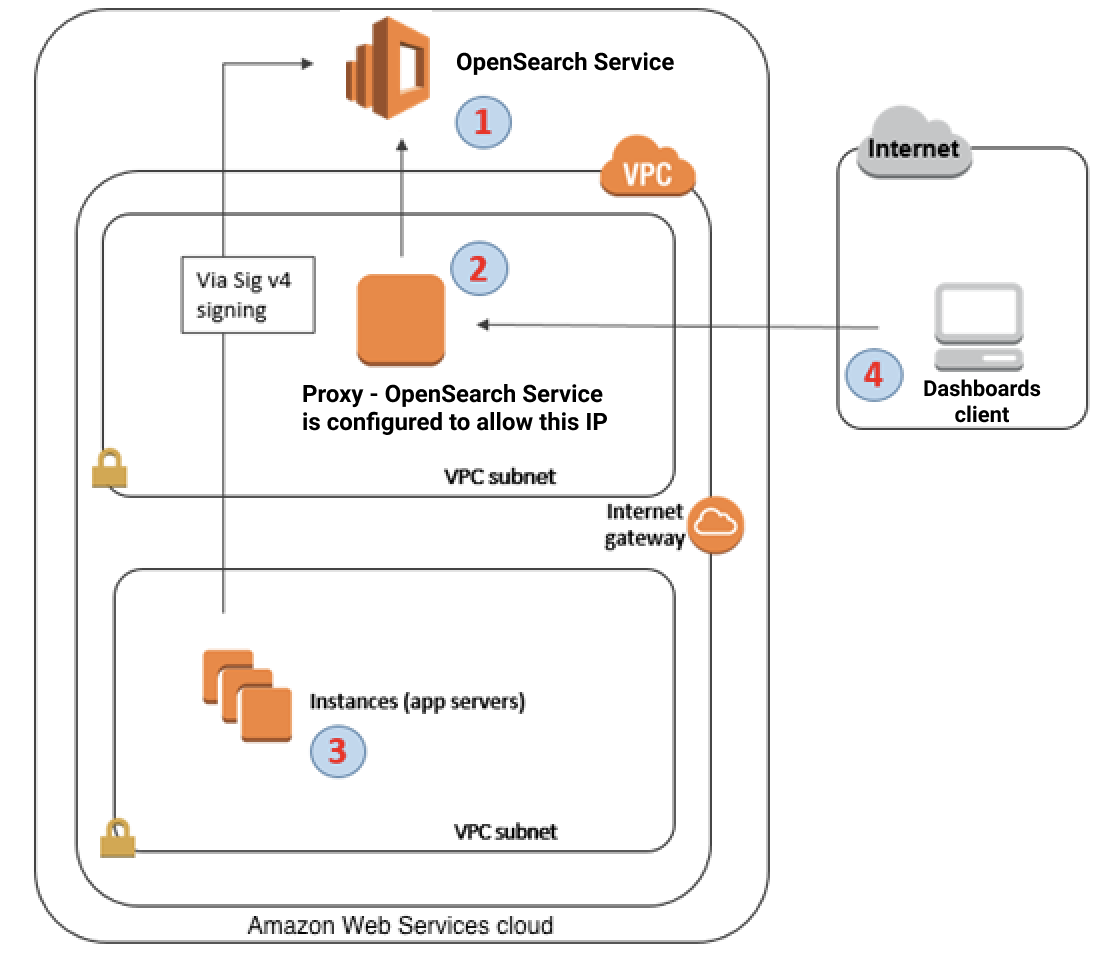
Because Dashboards is a JavaScript application, requests originate from the user's IP address. IP-based access control might be impractical due to the sheer number of IP addresses you would need to allow in order for each user to have access to Dashboards. One workaround is to place a proxy server between Dashboards and OpenSearch Service. Then you can add an IP-based access policy that allows requests from only one IP address, the proxy's. The following diagram shows this configuration.
-
This is your OpenSearch Service domain. IAM provides authorized access to this domain. An additional, IP-based access policy provides access to the proxy server.
-
This is the proxy server, running on an Amazon EC2 instance.
-
Other applications can use the Signature Version 4 signing process to send authenticated requests to OpenSearch Service.
-
Dashboards clients connect to your OpenSearch Service domain through the proxy.
To enable this sort of configuration, you need a resource-based policy that specifies roles and IP addresses. Here's a sample policy:
We recommend that you configure the EC2 instance running the proxy server with an Elastic IP address. This way, you can replace the instance when necessary and still attach the same public IP address to it. To learn more, see Elastic IP Addresses in the Amazon EC2 User Guide.
If you use a proxy server and
Cognito authentication, you might need to add
settings for Dashboards and Amazon Cognito to avoid redirect_mismatch errors.
See the following nginx.conf example:
server {
    listen 443;
    server_name $host;
    rewrite ^/$ https://$host/_plugin/_dashboards redirect;

    ssl_certificate           /etc/nginx/cert.crt;
    ssl_certificate_key       /etc/nginx/cert.key;

    ssl on;
    ssl_session_cache  builtin:1000  shared:SSL:10m;
    ssl_protocols  TLSv1 TLSv1.1 TLSv1.2;
    ssl_ciphers HIGH:!aNULL:!eNULL:!EXPORT:!CAMELLIA:!DES:!MD5:!PSK:!RC4;
    ssl_prefer_server_ciphers on;

    location /_plugin/_dashboards {
        # Forward requests to Dashboards
        proxy_pass https://$dashboards_host/_plugin/_dashboards;

        # Handle redirects to Cognito
        proxy_redirect https://$cognito_host https://$host;

        # Update cookie domain and path
        proxy_cookie_domain $dashboards_host $host;
        proxy_cookie_path / /_plugin/_dashboards/;

        # Response buffer settings
        proxy_buffer_size 128k;
        proxy_buffers 4 256k;
        proxy_busy_buffers_size 256k;
    }

    location ~ \/(log|sign|fav|forgot|change|saml|oauth2) {
        # Forward requests to Cognito
        proxy_pass https://$cognito_host;

        # Handle redirects to Dashboards
        proxy_redirect https://$dashboards_host https://$host;

        # Update cookie domain
        proxy_cookie_domain $cognito_host $host;
    }
}
Note
(Optional) If you choose to provision a dedicated coordinator node, it will automatically start hosting OpenSearch Dashboards. As a result, the availability of data node resources such as CPU and memory is increased. This increased availability of data node resources can help to improve the overall resiliency of your domain.
Configuring Dashboards to use a WMS map server
The default installation of Dashboards for OpenSearch Service includes a map service, except for domains in the India and China Regions. The map service supports up to 10 zoom levels.
Regardless of your Region, you can configure Dashboards to use a different Web Map Service (WMS) server for coordinate map visualizations. Region map visualizations only support the default map service.
To configure Dashboards to use a WMS map server:
-
Open Dashboards.
-
Choose Stack Management.
-
Choose Advanced Settings.
-
Locate visualization:tileMap:WMSdefaults.
-
Change
enabledtotrueandurlto the URL of a valid WMS map server:{ "enabled": true, "url": "wms-server-url", "options": { "format": "image/png", "transparent": true } } -
Choose Save changes.
To apply the new default value to visualizations, you might need to reload Dashboards. If you have saved visualizations, choose Options after opening the visualization. Verify that WMS map server is enabled and WMS url contains your preferred map server, and then choose Apply changes.
Note
Map services often have licensing fees or restrictions. You are responsible for
all such considerations on any map server that you specify. You might find the map
services from the U.S. Geological
Survey
Connecting a local Dashboards server to OpenSearch Service
If you already invested significant time into configuring your own Dashboards instance, you can use it instead of (or in addition to) the default Dashboards instance that OpenSearch Service provides. The following procedure works for domains that use fine-grained access control with an open access policy.
To connect a local Dashboards server to OpenSearch Service
-
On your OpenSearch Service domain, create a user with the appropriate permissions:
-
In Dashboards, go to Security, Internal users, and choose Create internal user.
-
Provide a username and password and choose Create.
-
Go to Roles and select a role.
-
Select Mapped users and choose Manage mapping.
-
In Users, add your username and choose Map.
-
-
Download and install the appropriate version of the OpenSearch security plugin
on your self-managed Dashboards OSS installation. -
On your local Dashboards server, open the
config/opensearch_dashboards.ymlfile and add your OpenSearch Service endpoint with the username and password you created earlier:opensearch.hosts: ['https://domain-endpoint'] opensearch.username: 'username' opensearch.password: 'password'You can use the following sample
opensearch_dashboards.ymlfile:server.host: '0.0.0.0' opensearch.hosts: ['https://domain-endpoint'] opensearchDashboards.index: ".username" opensearch.ssl.verificationMode: none # if not using HTTPS opensearch_security.auth.type: basicauth opensearch_security.auth.anonymous_auth_enabled: false opensearch_security.cookie.secure: false # set to true when using HTTPS opensearch_security.cookie.ttl: 3600000 opensearch_security.session.ttl: 3600000 opensearch_security.session.keepalive: false opensearch_security.multitenancy.enabled: false opensearch_security.readonly_mode.roles: ['opensearch_dashboards_read_only'] opensearch_security.auth.unauthenticated_routes: [] opensearch_security.basicauth.login.title: 'Please log in using your username and password' opensearch.username: 'username' opensearch.password: 'password' opensearch.requestHeadersWhitelist: [authorization, securitytenant, security_tenant]
To see your OpenSearch Service indexes, start your local Dashboards server, go to Dev Tools and run the following command:
GET _cat/indices
Managing indexes in Dashboards
The Dashboards installation on your OpenSearch Service domain provides a useful UI for managing indexes in different storage tiers on your domain. Choose Index Management from the Dashboards main menu to view all indexes in hot, UltraWarm, and cold storage, as well as indexes managed by Index State Management (ISM) policies. Use index management to move indexes between warm and cold storage, and to monitor migrations between the three tiers.

Note that you won't see the hot, warm, and cold index options unless you have UltraWarm and/or cold storage enabled.
Additional features
The default Dashboards installation on each OpenSearch Service domain has some additional features:
-
User interfaces for the various OpenSearch plugins
-
Use the Reporting menu to generate on-demand CSV reports from the Discover page and PDF or PNG reports of dashboards or visualizations. CSV reports have a 10,000 row limit.
