View a high-level application history in Amazon EMR
Note
We recommend that you use the persistent application interface for an improved
user experience that retains app history for up to 30 days. The high-level
application history described on this page isn't available in the new Amazon EMR console
(https://console.aws.amazon.com/emr
With Amazon EMR releases 5.8.0 to 5.36.0 and 6.x releases up to 6.8.0, you can view a high-level application history from the Application user interfaces tab in the old Amazon EMR console. An Amazon EMR Application user interface keeps the summary of application history for 7 days after an application has completed.
Considerations and limitations
Consider the following limitations when you use the Application user interfaces tab in the old Amazon EMR console.
-
You can only access the high-level application history feature when using Amazon EMR releases 5.8.0 to 5.36.0 and 6.x releases up to 6.8.0. Effective January 23, 2023, Amazon EMR will discontinue high-level application history for all versions. If you use Amazon EMR version 5.25.0 or higher, we recommend that you use the persistent application user interface instead.
-
The high-level application history feature does not support Spark Streaming applications.
-
One-click access to persistent application user interfaces is currently not available for Amazon EMR clusters with multiple master nodes or for Amazon EMR clusters integrated with AWS Lake Formation.
Example: View a high-level application history
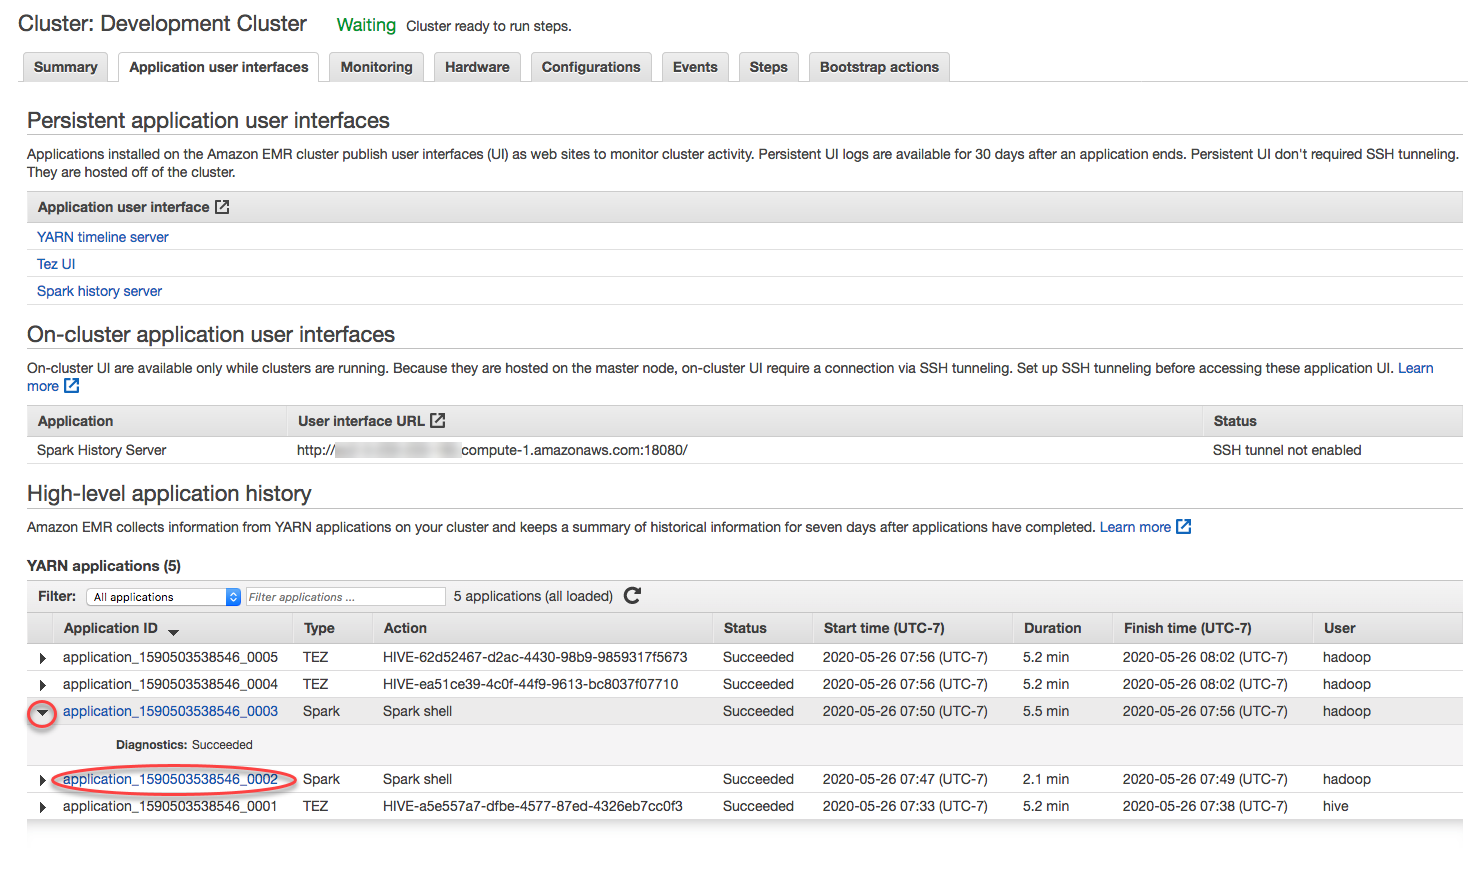
The following sequence demonstrates a drill-down through a Spark or YARN application into job details using the Application user interfaces tab on the cluster details page of the old console.
To view cluster details, select a cluster Name from the Clusters list. To view information about YARN container logs, you must enable logging for your cluster. For more information, see Configure cluster logging and debugging. For Spark application history, the information provided in the summary table is only a subset of the information available through the Spark history server UI.
In the Application user interfaces tab under High-level application history, you can expand a row to show the diagnostic summary for a Spark application or select an Application ID link to view details about a different application.
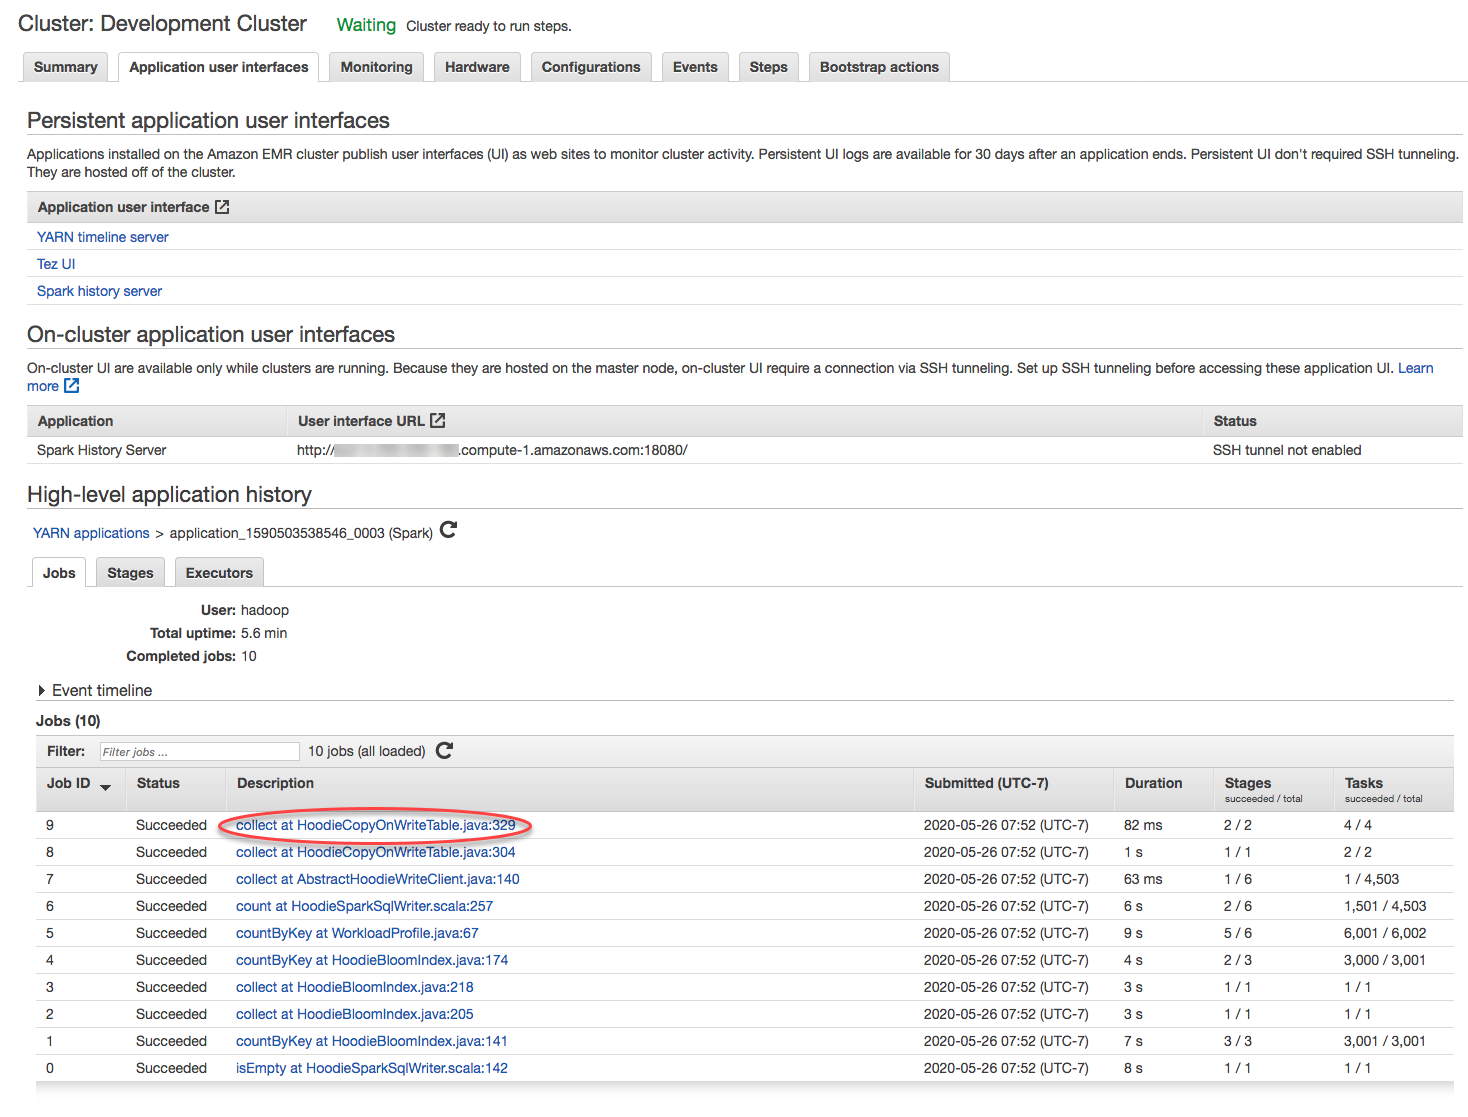
When you select an Application ID link, the UI changes to show the YARN application details for that application. In the Jobs tab of YARN application details, you can choose the Description link for a job to display details for that job.
On the job details page, you can expand information about individual job stages, and then select the Description link to see stage details.

On the stage details page, you can view key metrics for stage tasks and executors. You can also view task and executor logs using the View logs links.

