AWS X-Ray concepts
AWS X-Ray receives data from services as segments. X-Ray then groups segments that have a common request into traces. X-Ray processes the traces to generate a service graph that provides a visual representation of your application.
Concepts
Segments
The compute resources running your application logic send data about their work as segments. A segment provides the resource's name, details about the request, and details about the work done. For example, when an HTTP request reaches your application, it can record the following data about:
-
The host – hostname, alias or IP address
-
The request – method, client address, path, user agent
-
The response – status, content
-
The work done – start and end times, subsegments
-
Issues that occur – errors, faults and exceptions, including automatic capture of exception stacks.
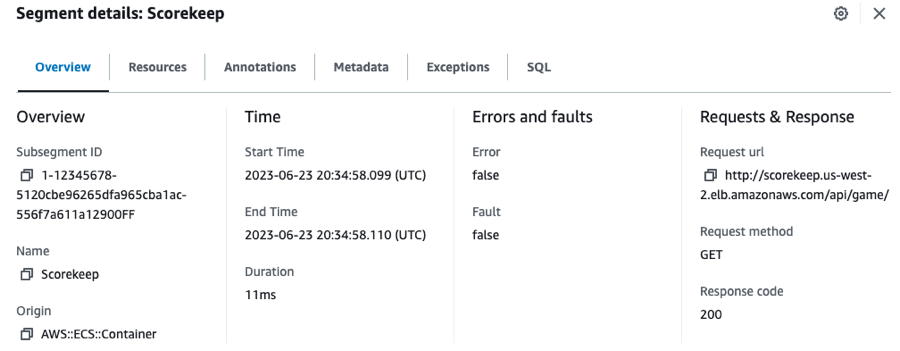
The X-Ray SDK gathers information from request and response headers, the code in your application, and metadata about the AWS resources on which it runs. You choose the data to collect by modifying your application configuration or code to instrument incoming requests, downstream requests, and AWS SDK clients.
Forwarded Requests
If a load balancer or other intermediary forwards a request to your application,
X-Ray takes the client IP from the X-Forwarded-For header in the
request instead of from the source IP in the IP packet. The client IP that is recorded for a forwarded
request can be forged, so it should not be trusted.
You can use the X-Ray SDK to record additional information such as annotations and metadata. For details about the structure and information that is recorded in segments and subsegments, see AWS X-Ray segment documents. Segment documents can be up to 64 kB in size.
Subsegments
A segment can break down the data about the work done into subsegments. Subsegments provide more granular timing information and details about downstream calls that your application made to fulfill the original request. A subsegment can contain additional details about a call to an AWS service, an external HTTP API, or an SQL database. You can even define arbitrary subsegments to instrument specific functions or lines of code in your application.

For services that don't send their own segments, like Amazon DynamoDB, X-Ray uses subsegments to generate inferred segments and downstream nodes on the trace map. This lets you see all of your downstream dependencies, even if they don't support tracing, or are external.
Subsegments represent your application's view of a downstream call as a client. If the downstream service is also instrumented, the segment that it sends replaces the inferred segment generated from the upstream client's subsegment. The node on the service graph always uses information from the service's segment, if it's available, while the edge between the two nodes uses the upstream service's subsegment.
For example, when you call DynamoDB with an instrumented AWS SDK client, the X-Ray SDK records a subsegment for that call. DynamoDB doesn't send a segment, so the inferred segment in the trace, the DynamoDB node on the service graph, and the edge between your service and DynamoDB all contain information from the subsegment.
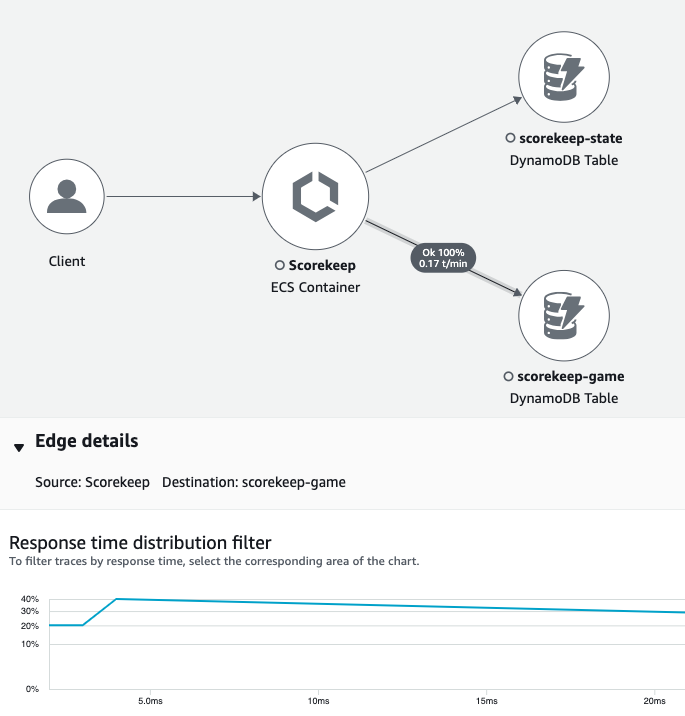
When you call another instrumented service with an instrumented application, the downstream service sends its own segment to record its view of the same call that the upstream service recorded in a subsegment. In the service graph, both services' nodes contain timing and error information from those services' segments, while the edge between them contains information from the upstream service's subsegment.

Both viewpoints are useful, as the downstream service records precisely when it started and ended work on the request, and the upstream service records the round trip latency, including time that the request spent traveling between the two services.
Service graph
X-Ray uses the data that your application sends to generate a service graph. Each AWS resource that sends data to X-Ray appears as a service in the graph. Edges connect the services that work together to serve requests. Edges connect clients to your application, and your application to the downstream services and resources that it uses.
Service Names
A segment's name should match the domain name or logical name of the service
that generates the segment. However, this is not enforced. Any application that has permission to
PutTraceSegments can send segments with any name.
A service graph is a JSON document that contains information about the services and resources that make up your application. The X-Ray console uses the service graph to generate a visualization or service map.
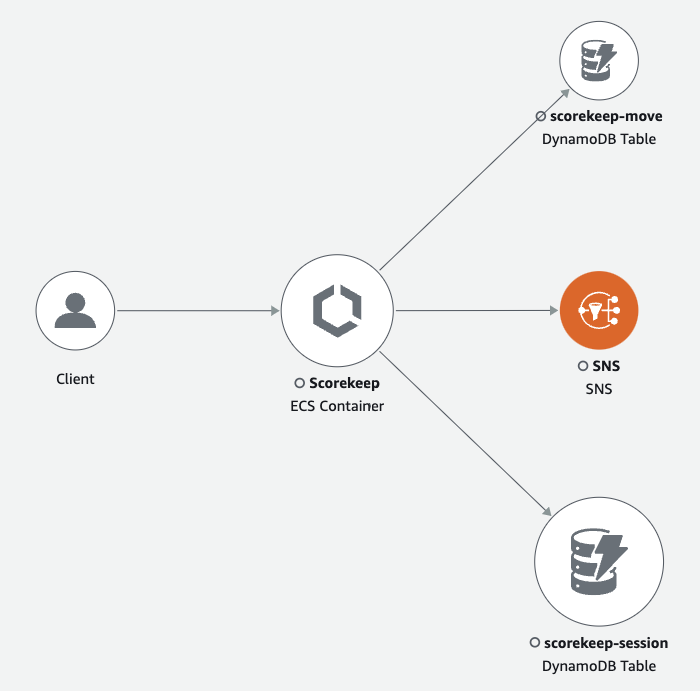
For a distributed application, X-Ray combines nodes from all services that process requests with the same trace ID into a single service graph. The first service that the request hits adds a tracing header that is propagated between the front end and services that it calls.
For example, Scorekeep runs a web API that calls a microservice (an AWS Lambda function) to generate a random name by using a Node.js library. The X-Ray SDK for Java generates the trace ID and includes it in calls to Lambda. Lambda sends tracing data and passes the trace ID to the function. The X-Ray SDK for Node.js also uses the trace ID to send data. As a result, nodes for the API, the Lambda service, and the Lambda function all appear as separate, but connected, nodes on the trace map.
Service graph data is retained for 30 days.
Traces
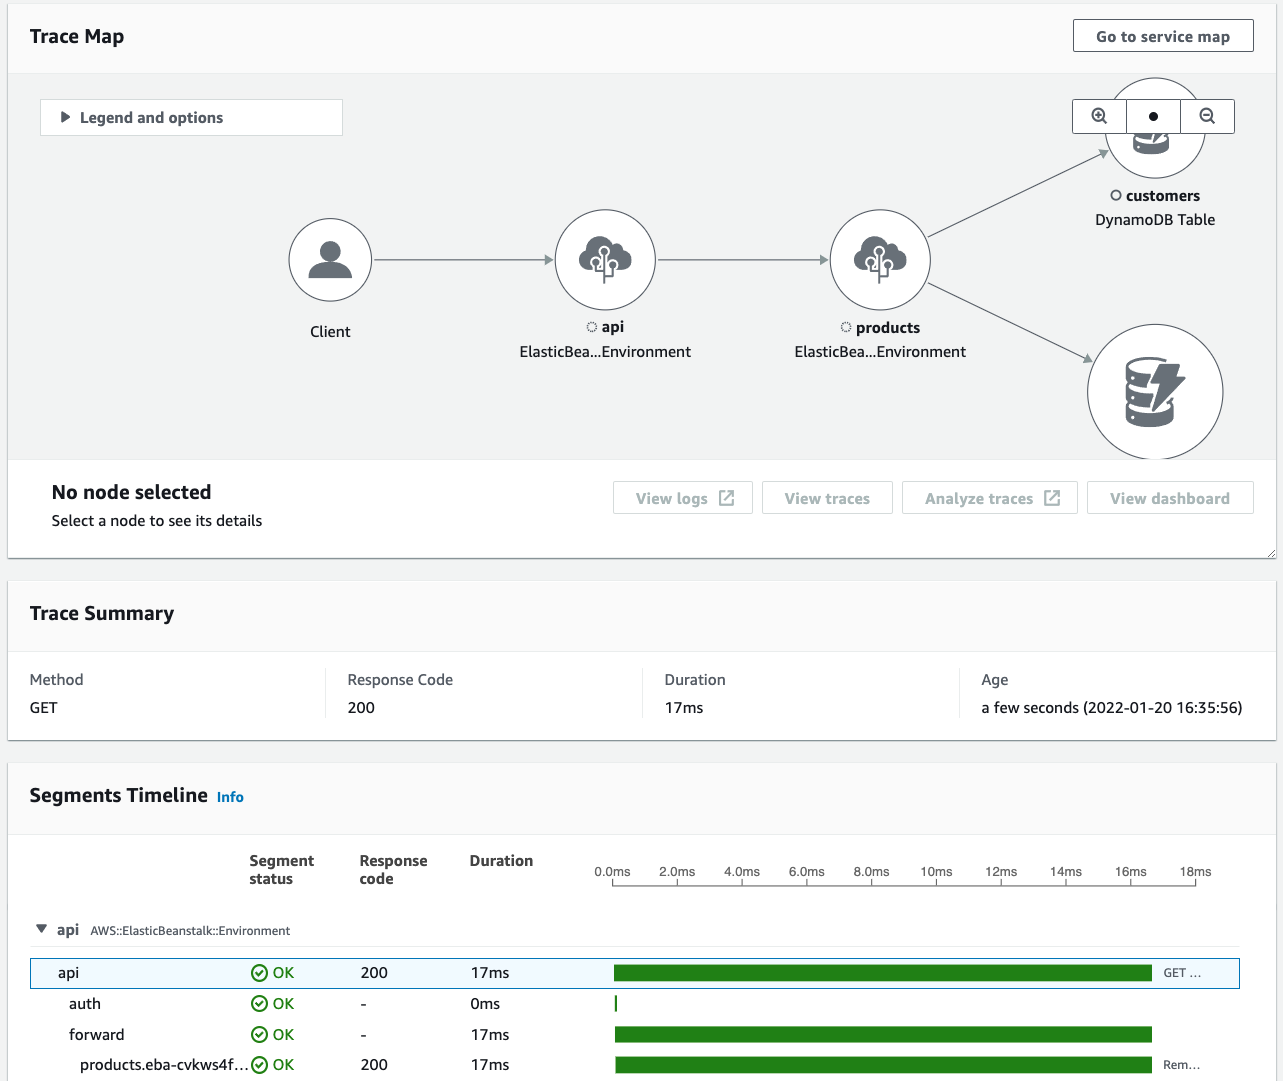
A trace ID tracks the path of a request through your application. A trace collects all the segments generated by a single request. That request is typically an HTTP GET or POST request that travels through a load balancer, hits your application code, and generates downstream calls to other AWS services or external web APIs. The first supported service that the HTTP request interacts with adds a trace ID header to the request, and propagates it downstream to track the latency, disposition, and other request data.
See AWS X-Ray pricing
Sampling
To ensure efficient tracing and provide a representative sample of the requests that your application serves, the X-Ray SDK applies a sampling algorithm to determine which requests get traced. By default, the X-Ray SDK records the first request each second, and five percent of any additional requests.
To avoid incurring service charges when you are getting started, the default sampling rate is conservative. You can configure X-Ray to modify the default sampling rule and configure additional rules that apply sampling based on properties of the service or request.
For example, you might want to disable sampling and trace all requests for calls that modify state or handle users or transactions. For high-volume read-only calls, like background polling, health checks, or connection maintenance, you can sample at a low rate and still get enough data to see any issues that arise.
For more information, see Configuring sampling rules.
Tracing header
All requests are traced, up to a configurable minimum. After reaching that minimum, a percentage of requests
are traced to avoid unnecessary cost. The sampling decision and trace ID are added to HTTP requests in tracing headers named X-Amzn-Trace-Id. The first X-Ray-integrated service
that the request hits adds a tracing header, which is read by the X-Ray SDK and included in the response.
Example Tracing header with root trace ID and sampling decision
X-Amzn-Trace-Id: Root=1-5759e988-bd862e3fe1be46a994272793;Parent=53995c3f42cd8ad8;Sampled=1Tracing Header Security
A tracing header can originate from the X-Ray SDK, an AWS service, or the client request. Your
application can remove X-Amzn-Trace-Id from incoming requests to avoid issues caused by users
adding trace IDs or sampling decisions to their requests.
The tracing header can also contain a parent segment ID if the request originated from an instrumented application. For example, if your application calls a downstream HTTP web API with an instrumented HTTP client, the X-Ray SDK adds the segment ID for the original request to the tracing header of the downstream request. An instrumented application that serves the downstream request can record the parent segment ID to connect the two requests.
Example Tracing header with root trace ID, parent segment ID and sampling decision
X-Amzn-Trace-Id: Root=1-5759e988-bd862e3fe1be46a994272793;Parent=53995c3f42cd8ad8;Sampled=1Lineage may be appended to the trace header by Lambda and other AWS services as part of their processing mechanisms, and should not be directly used.
Example Tracing header with Lineage
X-Amzn-Trace-Id: Root=1-5759e988-bd862e3fe1be46a994272793;Parent=53995c3f42cd8ad8;Sampled=1;Lineage=25:a87bd80c:1Filter expressions
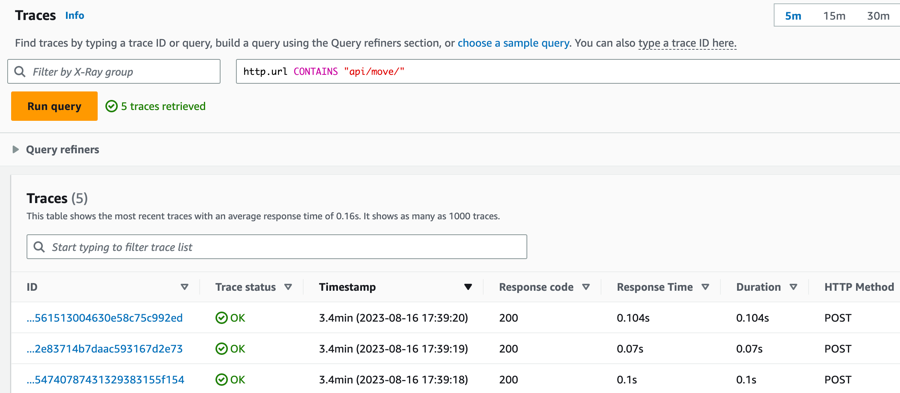
Even with sampling, a complex application generates a lot of data. The AWS X-Ray console provides an easy-to-navigate view of the service graph. It shows health and performance information that helps you identify issues and opportunities for optimization in your application. For advanced tracing, you can drill down to traces for individual requests, or use filter expressions to find traces related to specific paths or users.
Groups
Extending filter expressions, X-Ray also supports the group feature. Using a filter expression, you can define criteria by which to accept traces into the group.
You can call the group by name or by Amazon Resource Name (ARN) to generate its own service graph, trace summaries, and Amazon CloudWatch metrics. Once a group is created, incoming traces are checked against the group’s filter expression as they are stored in the X-Ray service. Metrics for the number of traces matching each criteria are published to CloudWatch every minute.
Updating a group's filter expression doesn't change data that's already recorded. The update applies only to subsequent traces. This can result in a merged graph of the new and old expressions. To avoid this, delete the current group and create a fresh one.
Note
Groups are billed by the number of retrieved traces that match the filter expression. For more information,
see AWS X-Ray pricing
For more information about groups, see Configuring groups.
Annotations and metadata
When you instrument your application, the X-Ray SDK records information about incoming and outgoing requests, the AWS resources used, and the application itself. You can add other information to the segment document as annotations and metadata. Annotations and metadata are aggregated at the trace level, and can be added to any segment or subsegment.
Annotations are simple key-value pairs that are indexed for use with filter expressions. Use annotations to record data that you want to use to
group traces in the console, or when calling the GetTraceSummaries API.
X-Ray indexes up to 50 annotations per trace.
Metadata are key-value pairs with values of any type, including objects and lists, but that are not indexed. Use metadata to record data you want to store in the trace but don't need to use for searching traces.
You can view annotations and metadata in the segment or subsegment details window, within the Trace details page in the CloudWatch console.

Errors, faults, and exceptions
X-Ray tracks errors that occur in your application code, and errors that are returned by downstream services. Errors are categorized as follows.
-
Error– Client errors (400 series errors) -
Fault– Server faults (500 series errors) -
Throttle– Throttling errors (429 Too Many Requests)
When an exception occurs while your application is serving an instrumented request, the X-Ray SDK records details about the exception, including the stack trace, if available. You can view exceptions under segment details in the X-Ray console.