Using box plots
Box plots, also known as box and whisker plots, display data pooled from multiple sources into one visual, helping you make data-driven decisions. Use a box plot to visualize how data is distributed across an axis or over time, for example flights delayed over a 7-day time period. Typically, a box plot details information in quarters:
-
Minimum – The lowest data point excluding outliers.
-
Maximum – The highest data point excluding outliers.
-
Median – The middle value of the dataset.
-
First Quartile – The middle value between the smallest number and the median of the dataset. The first quartile doesn't include the minimum or the median.
-
Third Quartile – The middle value between the largest number and the median of the dataset. The third quartile doesn't include the maximum or the median.
Outliers are extreme data points that aren't included in the calculation of a box plot's key values. Because outliers are calculated separately, their data points don't appear immediately after a box plot is created. Box plots display up to 10,000 data points. If a dataset contains more than 10,000 data points, a warning appears at the upper-right corner of the visual.
Box plots support up to five metrics and one group-by, but don't render if duplicate metrics are supplied.
Box plots support some calculated fields, but not all. Any calculated field that uses a
window function, for example avgOver, results in a SQL error.
Box plot visuals aren't compatible with MySQL 5.3 and earlier.
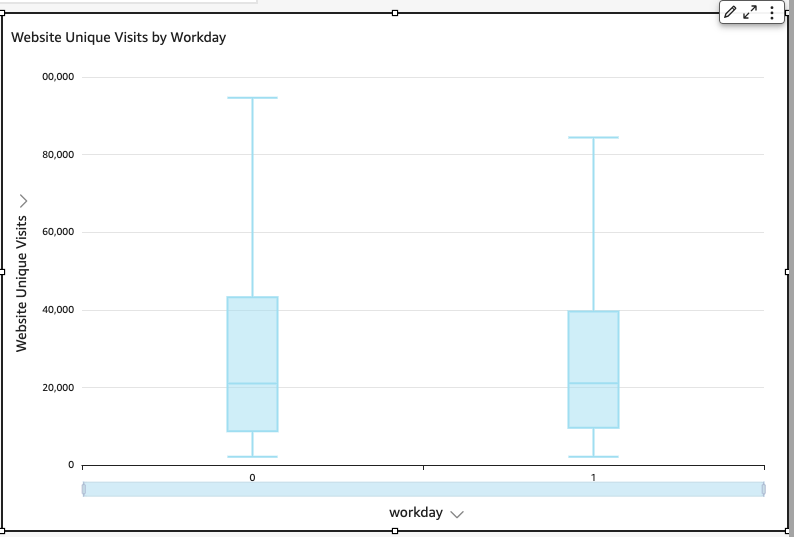
The following screenshot shows a box plot.

The icon for a box plot is as follows.
To create a basic box plot visual
-
Sign in to Amazon QuickSight at https://quicksight.aws.amazon.com/
. -
Open Amazon QuickSight and choose Analyses on the navigation pane at left.
-
Choose one of the following:
-
To create a new analysis, choose New analysis at upper right. For more information, see Starting an analysis in Amazon QuickSight.
-
To use an existing analysis, choose the analyses that you want to edit.
-
-
Choose Add, Add visual.
-
At lower left, choose the box plot icon from Visual types.
-
On the Fields list pane, choose the fields that you want to use for the appropriate field wells. Box plots require at least one unique measure field.
-
(Optional) Add drill-down layers by dragging one or more additional fields to the Group/Color field well. For more information about adding drill-downs, see Adding drill-downs to visual data in Amazon QuickSight.
To understand the features supported by box plots, see Analytics formatting per type in QuickSight. For customization options, see Formatting in Amazon QuickSight.