Reference lines on visuals types in QuickSight
Reference lines are visual markings in a visual, similar to ruler lines. You typically use a reference line for a value that needs to be displayed with the data. You use the reference line to communicate thresholds or limits in values. The reference line isn't part of the data that's used to build a chart. Instead, it's based on a value that you enter or a field that you identify in the dataset used by a chart.
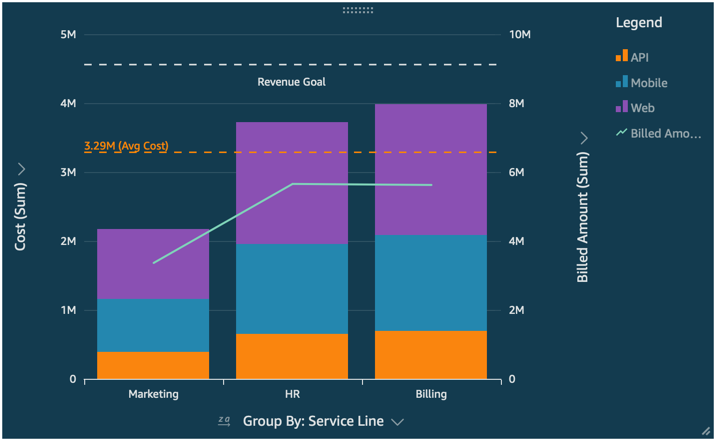
Amazon QuickSight supports reference lines in the following:
-
Bar charts
-
Line charts
-
Combo charts
You can create, change, and delete reference lines while designing an analysis. You can customize the line pattern, the label font, and the colors for each of those separately. You can show numeric values as numbers, currency, or percent. You can also customize a value's numerical format in the same way that you can customize a field in the field well.
There are two types of reference lines:
-
A constant line displays at a position that's based on a value that you specify in the format settings. This value doesn't need to relate to any field. You can customize the formatting of the line.
-
A calculated line displays at a position that's based on a value that is the result of a function. During configuration, you specify which measure (metric) you want to use and which aggregation to apply. These are the same aggregations you can apply to in the field wells. Then, you need to provide an aggregation to apply to the field calculation for the reference line, for example average, minimum, maximum, or percentile. The field needs to be in the dataset used by the chart, although it doesn't need to be displayed in the chart's field wells.
Calculated reference lines aren't supported in 100% stacked charts.
To add or edit a reference line (console)
-
Open the QuickSight console
. -
Open the analysis that you want to change.
-
Choose the visual that you want to change and open the Properties menu.
-
In the Properties pane that opens, open the Reference lines dropdown, and then choose ADD NEW LINE.
-
The New reference line menu opens. Use this menu to configure your new reference line. The list below describes all reference line properties that can be configured.
-
Data
-
Type – The type of reference line that you want to use. Choose one of the following options:
-
To create a constant line based on a single value that you enter, choose Constant line.
-
To create a calculated line based on a field, choose Calculated line.
-
-
Value – (For constant lines only) The value that you want to use. This becomes the location of the line on the visual. It appears immediately, so you can experiment with the setting.
-
Column – (For calculated lines only) The column that you want to use for the reference line.
-
Aggregated as (column) – (For calculated lines only) The aggregation that you want to apply to the selected column.
-
Calculate – (For calculated lines only) The calculation that you want to apply to the aggregation.
-
Percentile value – (Only if you set Calculate to Percentile) Enter a number from 1 through 100.
-
Chart type – (For combo charts) Choose Bars or Lines.
-
-
Line style
-
Pattern – The pattern used for the line. Valid options include Dashed, Dotted, and Solid.
-
Color – The color used for the line.
-
-
Label
-
Type – The type of label to display. Valid options include Value only, Custom text, Custom text and value, No label. If you choose an option that includes custom text, enter the label text that you want to appear on the line.
-
Enter custom text (text box) – (Only if you set Type to Custom text and value) Choose where to show the value in relation to the label. Valid options are Left or Right.
-
Position – The position of the label in relation to the line. Valid options include a combination of the following: left, middle, right, above, and below.
-
Value format – The format to use for the value. Choose one of the following:
-
Same as value – Uses the formatting that's already selected for this field in the visualization.
-
Show as – Choose from the available options, for example number, currency, or percent.
-
Format – Choose from the available formatting options.
-
-
Font size – The font size to use for the label text.
-
Color – The color to use for the label text.
-
-
-
Choose Done to save your selections.
To list existing reference lines
-
Choose the visual that you want to change and open the Properties pane.
-
In the Properties pane, open the Reference lines dropdown, and then choose the ellipsis (three dots) next to the line that you want to change.
-
Choose Edit.
-
The New reference line menu opens. Use this menu to make changes to your reference line. When you are finished, choose Done.
To disable a reference line
-
Choose the visual that you want to change and open the Properties pane.
-
In the Properties pane, open the Reference lines dropdown, and then choose the ellipsis (three dots) next to the line that you want to change.
-
Choose Disable.
To delete a reference line
-
Choose the visual that you want to change and open the Properties pane.
-
In the Properties pane, open the Reference lines dropdown, and then choose the ellipsis (three dots) next to the line that you want to change.
-
Choose Delete.
