You are currently viewing content for use with Unreal Engine software. See all AWS GameKit documentation
 Work with game feature dashboards
Summary
This topic is for game developers who want to monitor backend activity for their Unreal Engine projects. For each AWS GameKit feature, you can activate a custom Amazon CloudWatch metrics dashboard. Use these dashboards to monitor your backend AWS services set up through AWS GameKit.
In AWS GameKit, you can activate CloudWatch dashboards for your game's backend. Dashboards include metrics and alarms for the deployed AWS resources that run backend services for each game feature. These dashboards provide insight on operational activity across each game feature, and are typically used during game testing or in production when the game has an active player base.
Dashboards metrics include those used in the cost calculations for each AWS service. These metrics can provide clarity on how your game's backend activity is impacting cost.
For more information about CloudWatch dashboards, see Related AWS topics.
Activating or deactivating a dashboard
AWS GameKit dashboards track the metrics for a game feature's deployed AWS resources, and you manage dashboard status as part of the game feature configuration. If you deploy a game feature to more than one staging environment (such as QA and Production), you activate or deactivate the feature's dashboard in each environment. You can set the dashboard status for a feature at any time.
Note
The AWS Free Tier for CloudWatch includes up to three dashboards. If you activate multiple dashboards, you can exceed this quota and your AWS account can incur charges.
To set activation status for a dashboard
Set dashboard activation status in the AWS GameKit settings.
-
In the Unreal Editor toolbar, open Edit, Project Settings and go to the AwsGameKit plugin section. Select the environment you want to work with in Environment & Credentials.
-
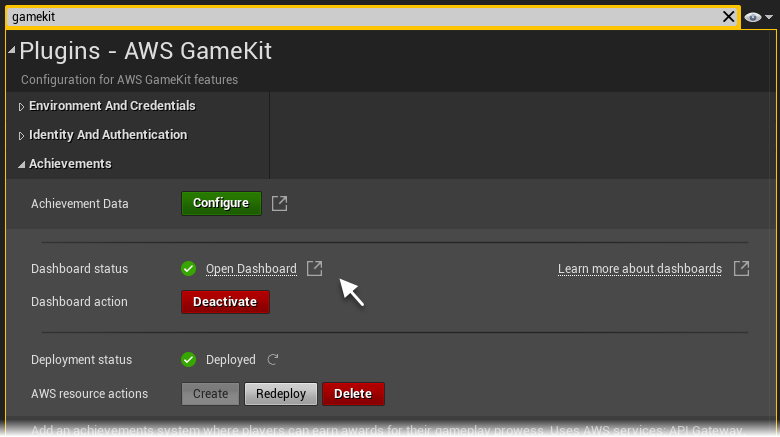
Open the game feature you want to activate or deactivate a dashboard for. Each game feature section displays the current dashboard status. In the preceding screenshot, the achievements feature dashboard has been deployed with an active dashboard.
-
For Dashboard action, choose Deactivate or Activate to change the feature's current dashboard status. If you activate the dashboard for a feature that isn't deployed yet, a dashboard is created during deployment. If the feature is already deployed, AWS GameKit creates or deletes the feature's dashboard. This update is made immediately; you don't have to redeploy the feature.
The default dashboard status depending on which environment is active. Dashboards are automatically activated in the Testing and Production environments.
You can track the change in the Deployment status field.
Opening a dashboard
You can access an activated dashboard for a deployed feature from your game engine or in the AWS Management Console for CloudWatch.
To open a dashboard from the game engine
Open game feature dashboards in the AWS GameKit settings.
-
In the Unreal Editor toolbar, open Edit, Project Settings and go to the AwsGameKit plugin section. Select the environment you want to work with in Environment & Credentials.
-
Open the feature you want to open a dashboard for. If the feature has an active dashboard, the Dashboard status field contains a check mark. If not, activate the dashboard and wait for AWS GameKit to create it, which takes up to a few minutes.
-
Choose Open Dashboard. The dashboard opens in a browser window in the AWS Management Console for CloudWatch.
Viewing dashboard content
Each AWS GameKit feature has its own dashboard. Dashboard names use the same naming
convention as the AWS resources that are deployed through AWS GameKit. For example, a
dashboard named
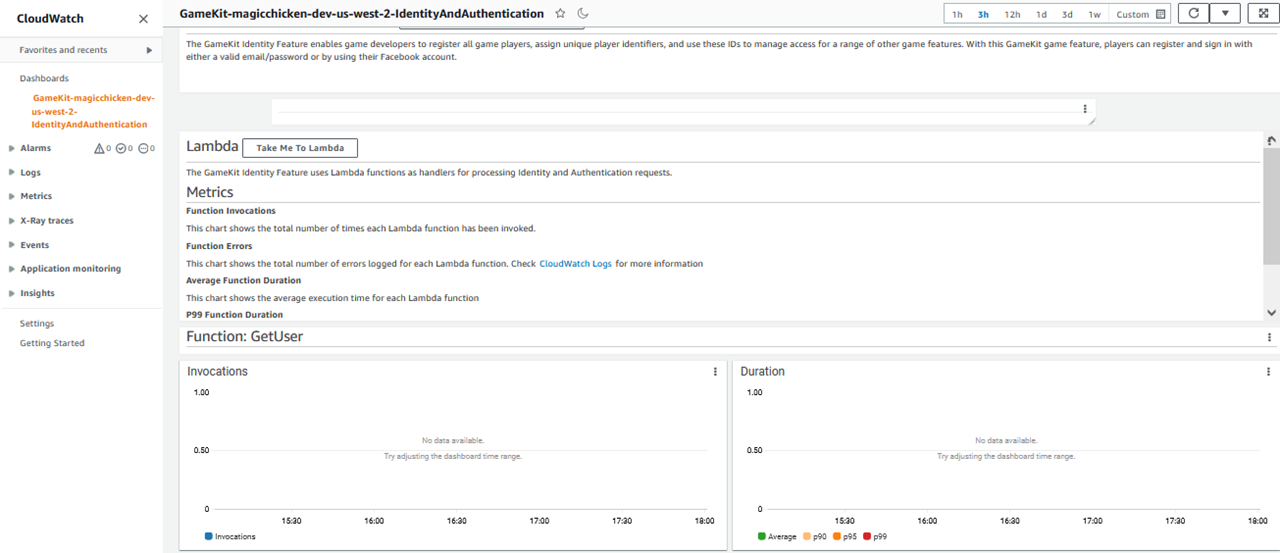
GameKit-magicchicken-dev-us-west-2-IdentityAndAuthentication tracks
AWS resources with a similar prefix. The name references the following information from your
game project's AWS GameKit configuration:
-
Alias/game title (as in "magicchicken").
-
Deployment environment (as in "dev").
-
Deployment AWS Region (as in "us-west-2").
-
Game feature (as in "IdentityAndAuthentication").
The dashboard is viewed in the AWS Management Console for CloudWatch, as shown in the following screenshot. Dashboard design and format varies by AWS GameKit version.
You can customize an AWS GameKit dashboard using the CloudWatch dashboard tools. These changes apply to this specific custom dashboard, and will be lost if this dashboard is deactivated. If you want to apply permanent or global changes to AWS GameKit dashboards, update your game's base templates for AWS GameKit.
Key dashboard metrics
Because each game feature uses a different collection of AWS services for its backend, the dashboard for each feature tracks a different set of metrics. However, all AWS GameKit dashboards include information from these core services.
AWS Lambda
All AWS GameKit game features use Lambda functions to handle processing for feature-related API requests. The Lambda metrics for each request type include the number of invocations and the average amount of compute time used to process the requests. Metrics to pay particular attention to include:
-
Latency (P99, P95 and P90). These charts show how long it takes for requests or operations to complete on the backend. When evaluating latency, there are no specific “good” or “bad” values; instead, watch for sudden increases that can result in a degradation in response time. To mitigate, consider adjusting the number of Lambda functions (see Update AWS Lambda settings in the launch readiness guide).
-
Concurrent executions. These charts track the number of functions the game backend executes at any single moment. In particular, look for an increase in latency with a constant number of concurrent executions. This scenario indicates that the number of concurrent executions isn't enough to handle the load. To mitigate, consider increasing the allowed number of concurrent executions (see Update AWS Lambda settings in the launch readiness guide).
-
Function errors. These charts show the number of errors per API. To understand the cause of these errors, inspect the Amazon CloudWatch logs and mitigate as needed.
Amazon API Gateway
All requests to the AWS GameKit API from game clients pass through API Gateway to backend Lambda functions. Metrics for API Gateway include the number of requests received over time and the average response time. Metrics to pay particular attention to include:
-
Latency (P99, P95 and P90). These charts show how long it takes it takes for requests or operations to complete on the backend. When evaluating latency, there are no specific “good” or “bad” values; instead, watch for sudden increases, which can result in a degradation in response time. To mitigate this scenario, inspect the latency charts for the underlying services (usually Lambda functions and DynamoDB) and mitigate based on the recommendations for each service.
-
4XX and 5XX errors. These charts show the number of errors per API Gateway resource. To understand the cause of these errors, inspect the Amazon CloudWatch logs and mitigate as needed.
Amazon Cognito
For games that use the AWS GameKit identity and authentication feature, Amazon Cognito manages all player registrations and logins, whether through username/password or through third-party identity providers such as Facebook. Metrics for Amazon Cognito track all authentication and security events involving AWS GameKit API requests. Metrics to pay particular attention to include:
-
Security. This chart shows the number of security-related events that occur. If you experience a high number of events, consider enabling advanced security features (see Update Amazon Cognito settings in the launch readiness guide).
Amazon DynamoDB
DynamoDB tables store a variety of information for AWS GameKit game features, including player IDs, achievement definitions, user gameplay data, game saves, and player achievement status. Metrics for DynamoDB include percentage capacity consumed, read/write activity, request latency, and other metrics relevant to individual game features. Metrics to pay particular attention to include:
-
Throttle. These charts track the number of throttled requests and events.
-
Table request latency. These show how long it takes for requests or operations to complete on DynamoDB . When evaluating latency, there are no specific “good” or “bad” values; instead, watch for sudden increases, which can result in a degradation in response time.
To mitigate throttling or latency issues, consider enabling the DynamoDB auto scaling feature (see Update Amazon DynamoDB settings in the launch readiness guide).
Related AWS topics
-
Amazon CloudWatch User Guide: Using Amazon CloudWatch dashboards
