Monitoring for DPU capacity planning
You can use job metrics in AWS Glue to estimate the number of data processing units (DPUs) that can be used to scale out an AWS Glue job.
Note
This page is only applicable to AWS Glue versions 0.9 and 1.0. Later versions of AWS Glue contain cost-saving features that introduce additional considerations when capacity planning.
Topics
Profiled code
The following script reads an Amazon Simple Storage Service (Amazon S3) partition containing 428 gzipped JSON files. The script applies a mapping to change the field names, and converts and writes them to Amazon S3 in Apache Parquet format. You provision 10 DPUs as per the default and run this job.
datasource0 = glueContext.create_dynamic_frame.from_options(connection_type="s3", connection_options = {"paths": [input_path], "useS3ListImplementation":True,"recurse":True}, format="json")
applymapping1 = ApplyMapping.apply(frame = datasource0, mappings = [(map_spec])
datasink2 = glueContext.write_dynamic_frame.from_options(frame = applymapping1, connection_type = "s3", connection_options = {"path": output_path}, format = "parquet")
Visualize the profiled metrics on the AWS Glue console
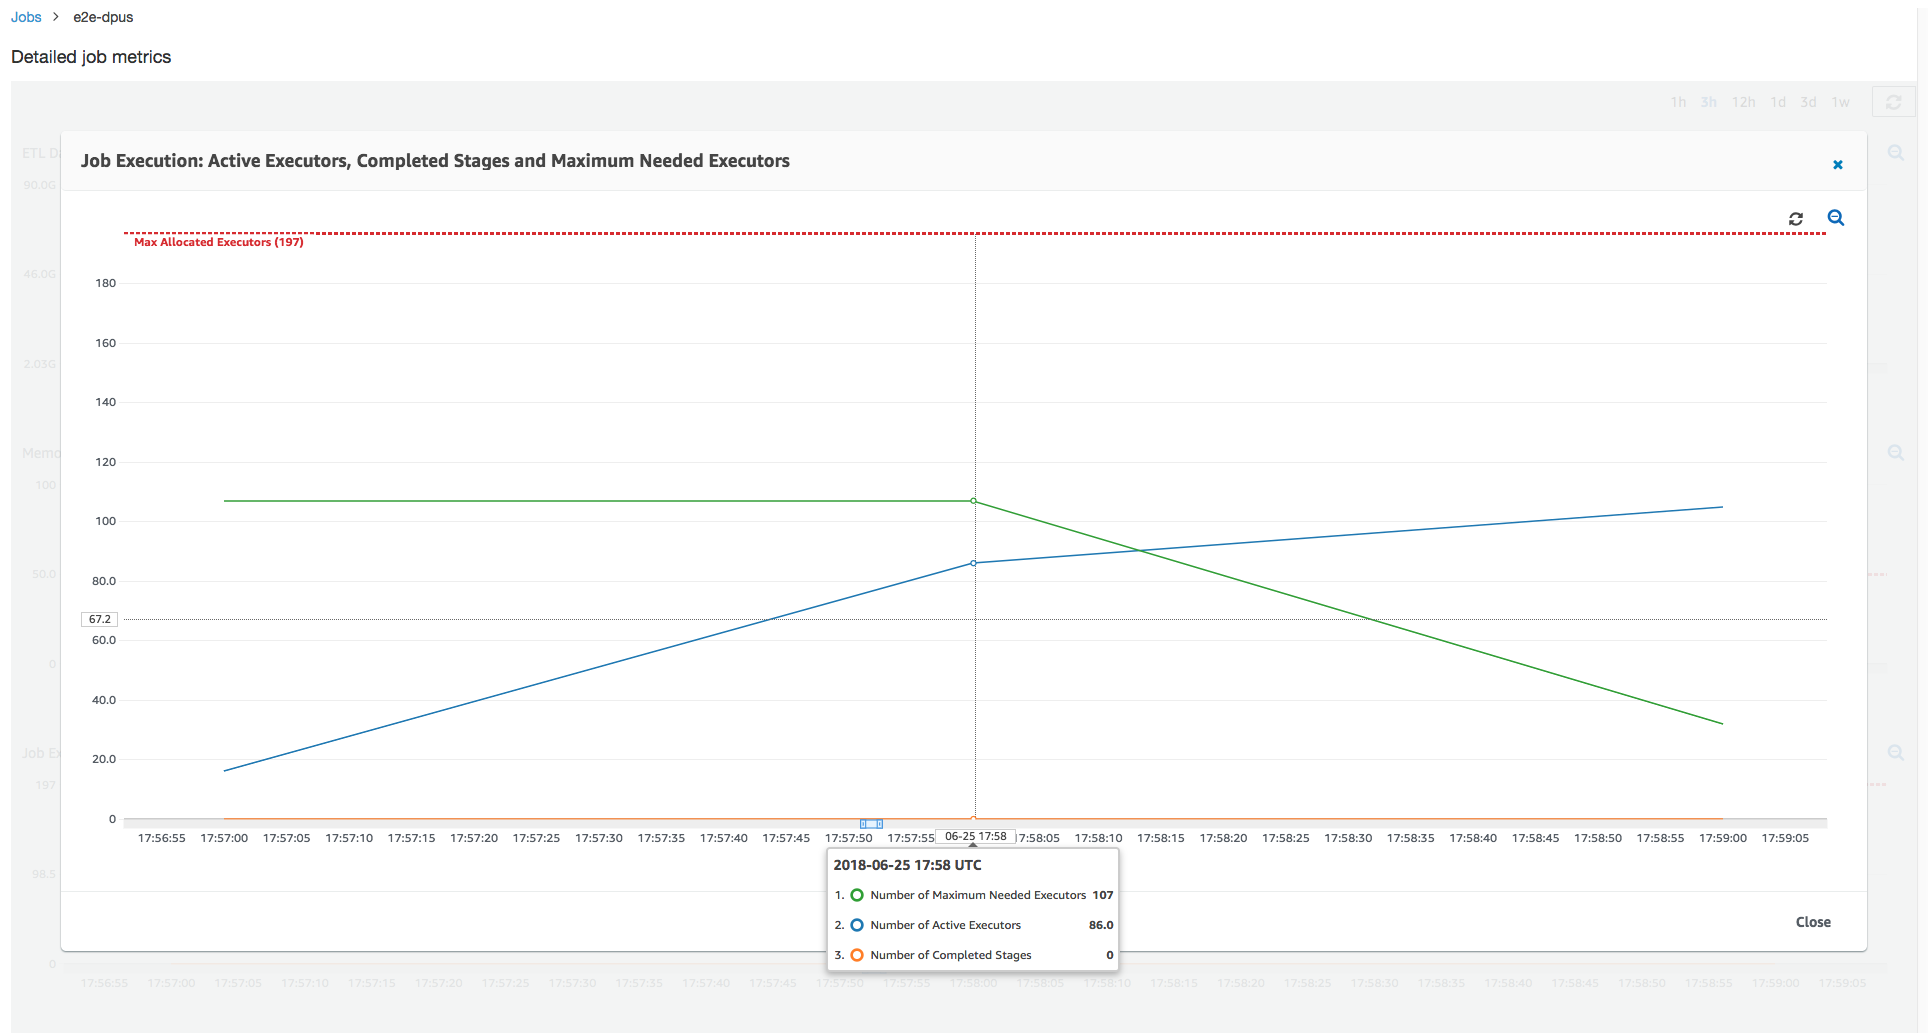
Job run 1: In this job run we show how to find if there are under-provisioned DPUs in the cluster. The job execution functionality in AWS Glue shows the total number of actively running executors, the number of completed stages, and the number of maximum needed executors.
The number of maximum needed executors is computed by adding the total number of running tasks and pending tasks, and dividing by the tasks per executor. This result is a measure of the total number of executors required to satisfy the current load.
In contrast, the number of actively running executors measures how many executors are running active Apache Spark tasks. As the job progresses, the maximum needed executors can change and typically goes down towards the end of the job as the pending task queue diminishes.
The horizontal red line in the following graph shows the number of maximum allocated executors, which depends on the number of DPUs that you allocate for the job. In this case, you allocate 10 DPUs for the job run. One DPU is reserved for management. Nine DPUs run two executors each and one executor is reserved for the Spark driver. The Spark driver runs inside the primary application. So, the number of maximum allocated executors is 2*9 - 1 = 17 executors.
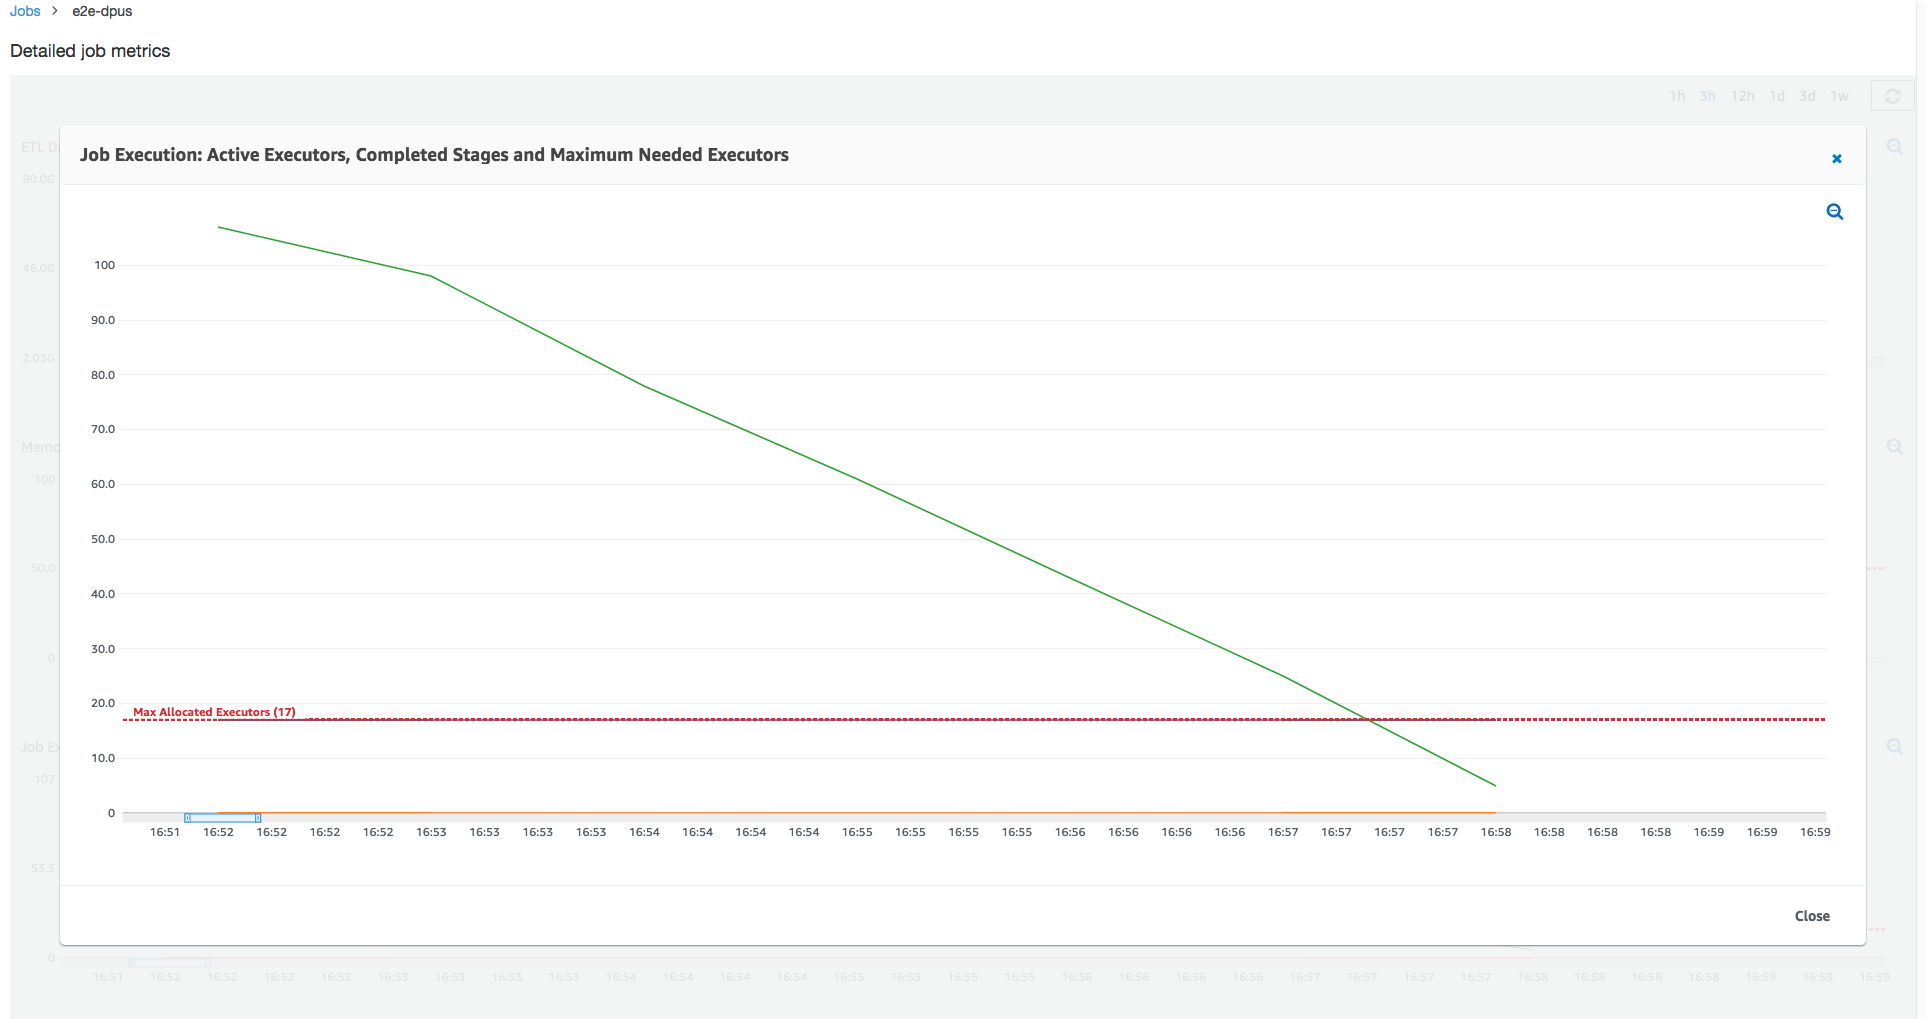
As the graph shows, the number of maximum needed executors starts at 107 at the beginning of the job, whereas the number of active executors remains 17. This is the same as the number of maximum allocated executors with 10 DPUs. The ratio between the maximum needed executors and maximum allocated executors (adding 1 to both for the Spark driver) gives you the under-provisioning factor: 108/18 = 6x. You can provision 6 (under provisioning ratio) *9 (current DPU capacity - 1) + 1 DPUs = 55 DPUs to scale out the job to run it with maximum parallelism and finish faster.
The AWS Glue console displays the detailed job metrics as a static line representing the original number of maximum allocated executors. The console computes the maximum allocated executors from the job definition for the metrics. By constrast, for detailed job run metrics, the console computes the maximum allocated executors from the job run configuration, specifically the DPUs allocated for the job run. To view metrics for an individual job run, select the job run and choose View run metrics.
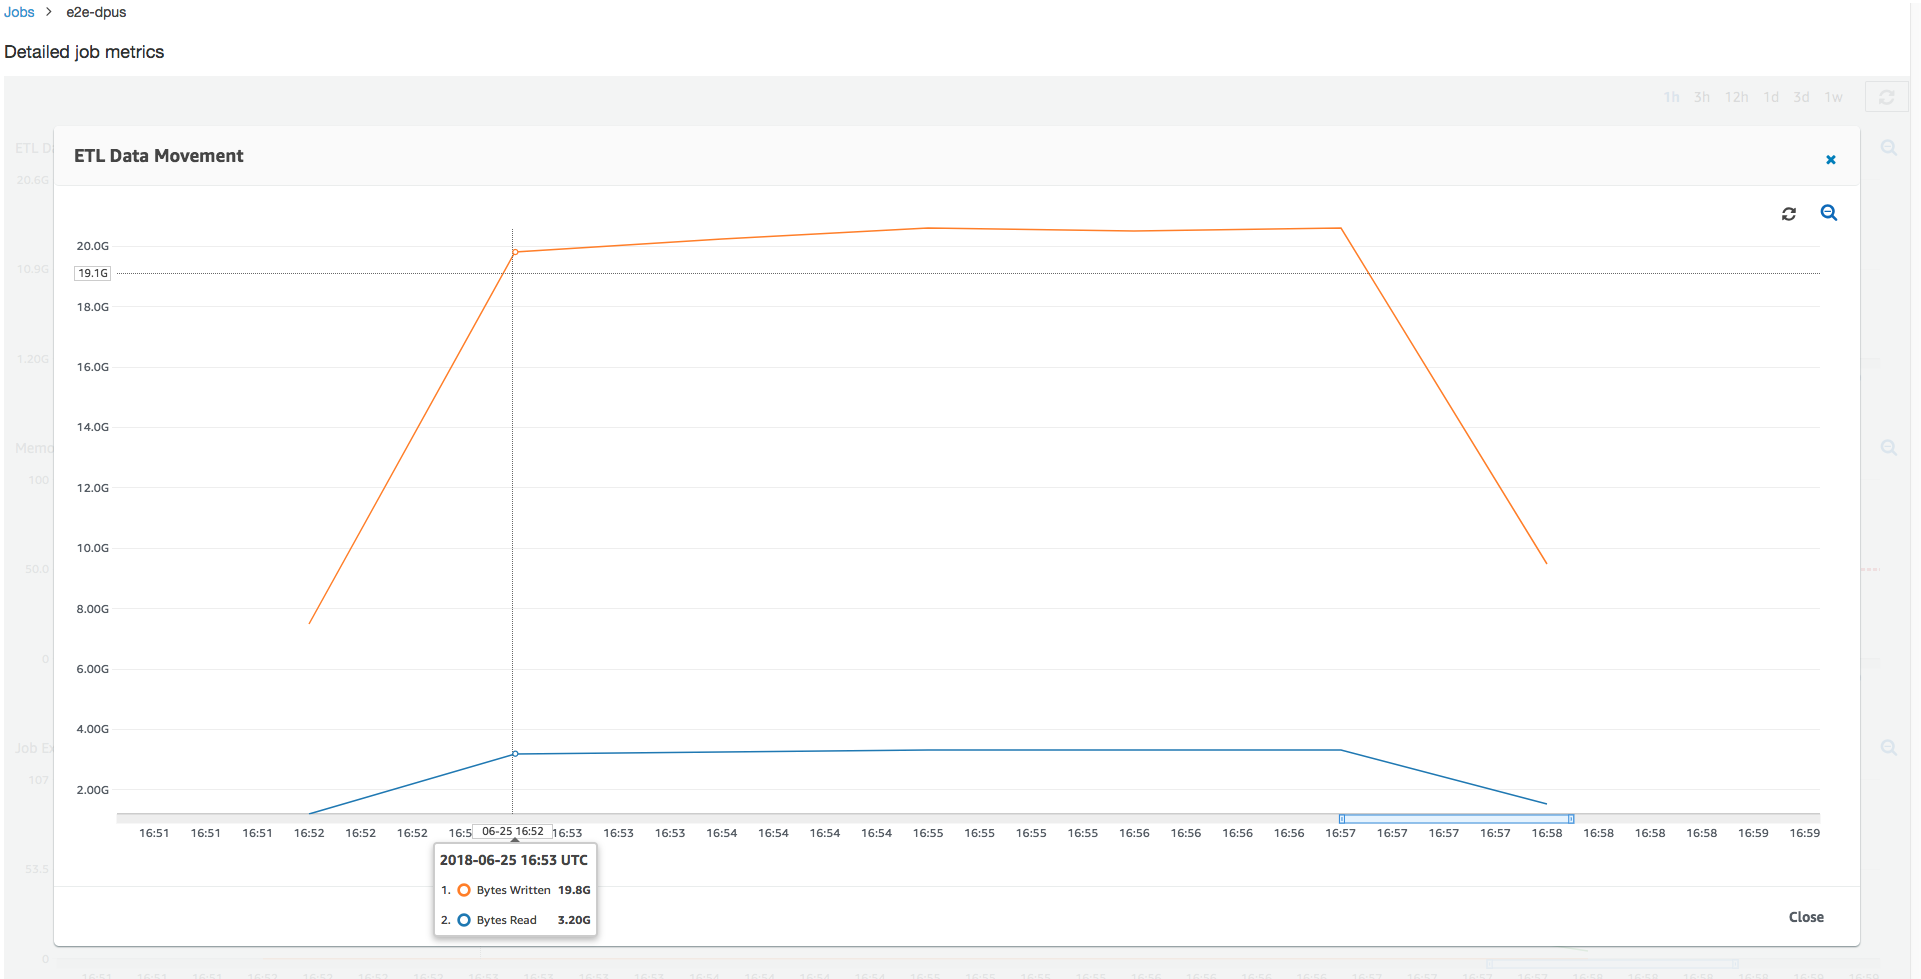
Looking at the Amazon S3 bytes read and written, notice that the job spends all six minutes streaming in data from Amazon S3 and writing it out in parallel. All the cores on the allocated DPUs are reading and writing to Amazon S3. The maximum number of needed executors being 107 also matches the number of files in the input Amazon S3 path—428. Each executor can launch four Spark tasks to process four input files (JSON gzipped).
Determine the optimal DPU capacity
Based on the results of the previous job run, you can increase the total number of allocated DPUs to 55, and see how the job performs. The job finishes in less than three minutes—half the time it required previously. The job scale-out is not linear in this case because it is a short running job. Jobs with long-lived tasks or a large number of tasks (a large number of max needed executors) benefit from a close-to-linear DPU scale-out performance speedup.
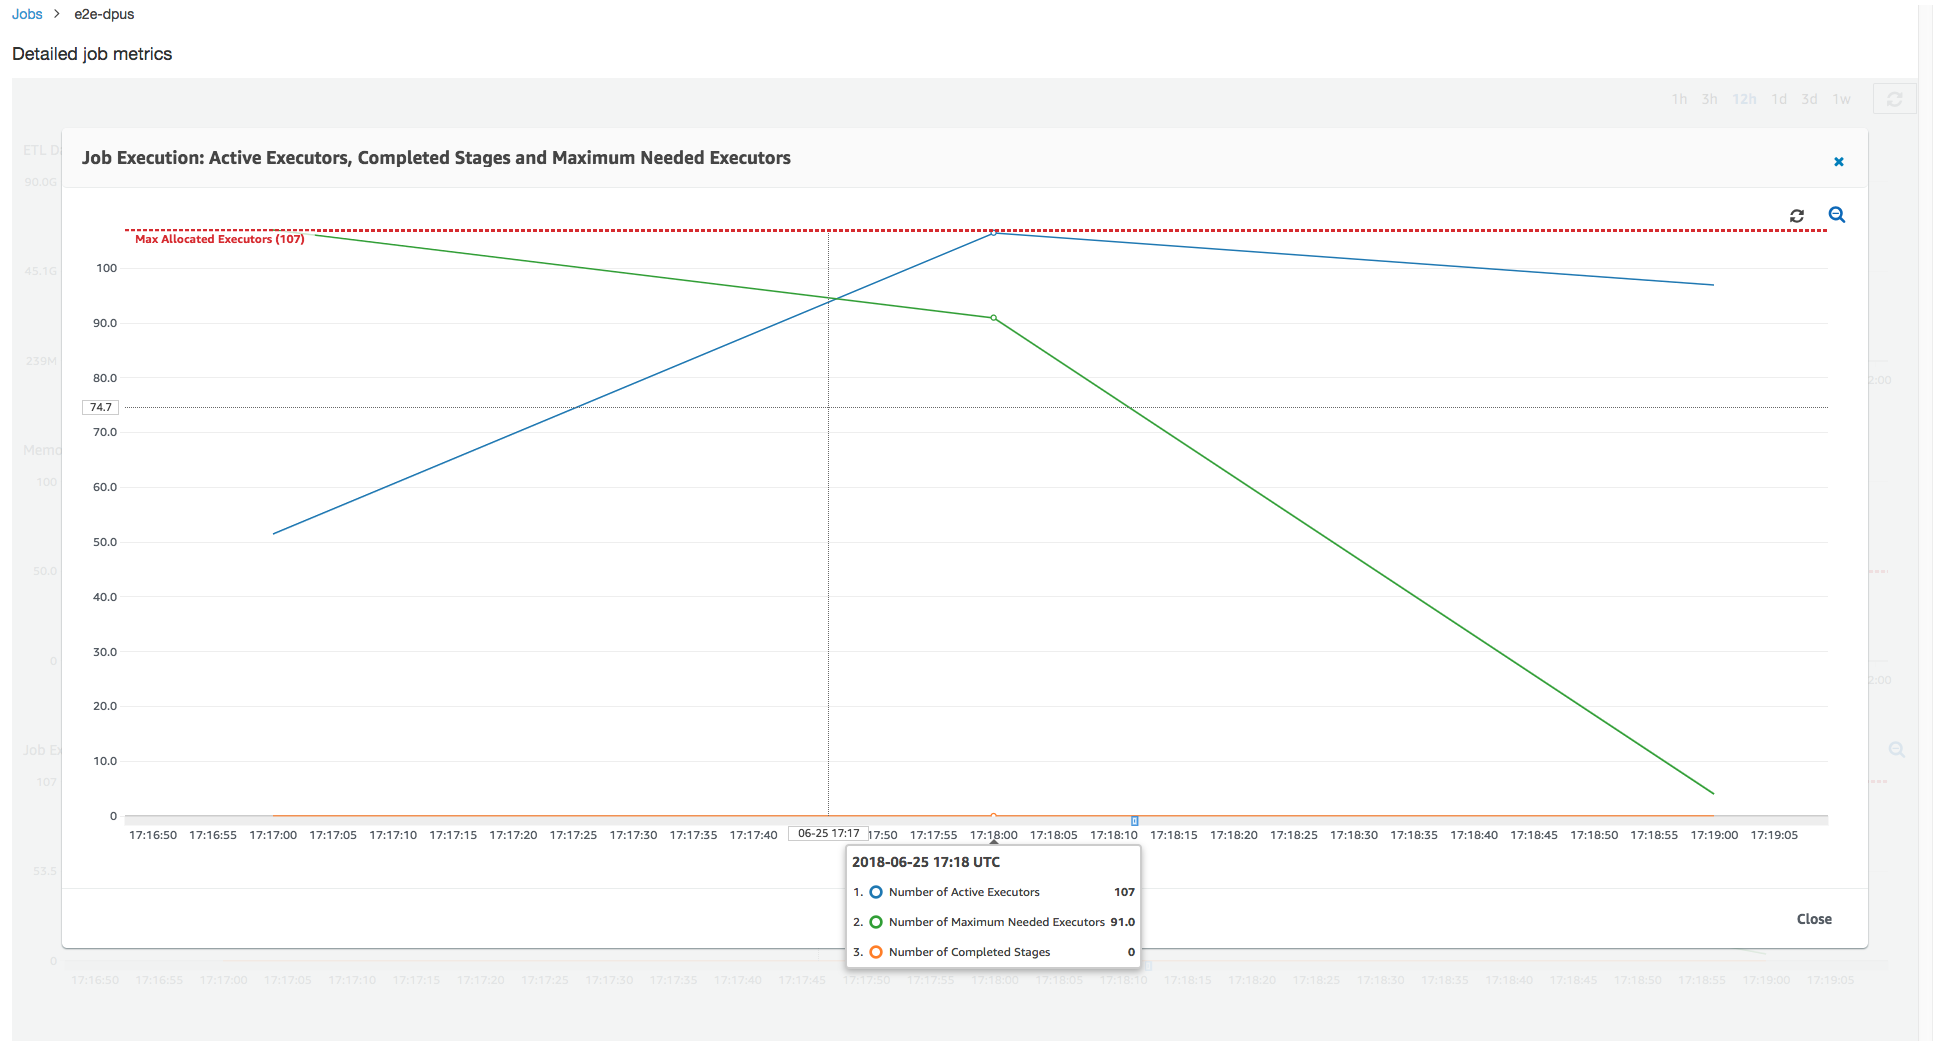
As the above image shows, the total number of active executors reaches the maximum allocated—107 executors. Similarly, the maximum needed executors is never above the maximum allocated executors. The maximum needed executors number is computed from the actively running and pending task counts, so it might be smaller than the number of active executors. This is because there can be executors that are partially or completely idle for a short period of time and are not yet decommissioned.
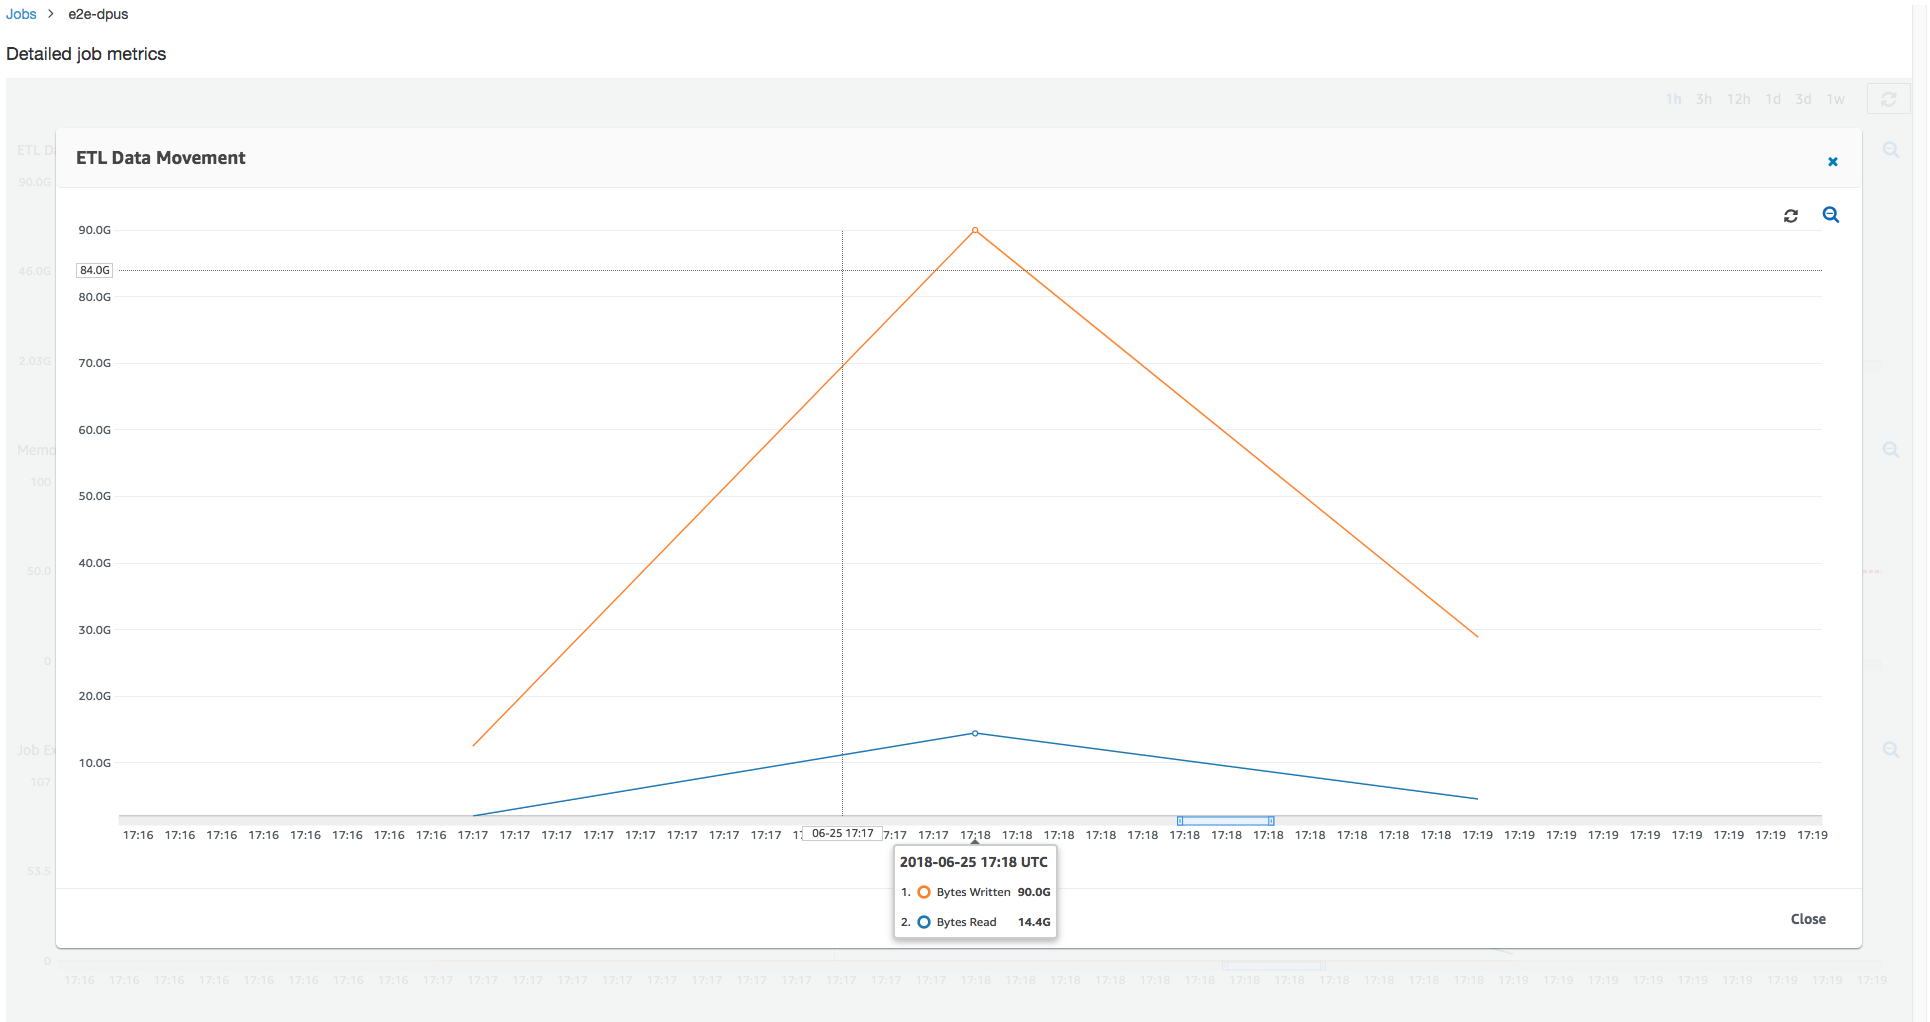
This job run uses 6x more executors to read and write from Amazon S3 in parallel. As a result, this job run uses more Amazon S3 bandwidth for both reads and writes, and finishes faster.
Identify overprovisioned DPUs
Next, you can determine whether scaling out the job with 100 DPUs (99 * 2 = 198 executors) helps to scale out any further. As the following graph shows, the job still takes three minutes to finish. Similarly, the job does not scale out beyond 107 executors (55 DPUs configuration), and the remaining 91 executors are overprovisioned and not used at all. This shows that increasing the number of DPUs might not always improve performance, as evident from the maximum needed executors.
Compare time differences
The three job runs shown in the following table summarize the job execution times for 10 DPUs, 55 DPUs, and 100 DPUs. You can find the DPU capacity to improve the job execution time using the estimates you established by monitoring the first job run.
| Job ID | Number of DPUs | Execution time |
|---|---|---|
| jr_c894524c8ef5048a4d9... | 10 | 6 min. |
| jr_1a466cf2575e7ffe6856... | 55 | 3 min. |
| jr_34fa1ed4c6aa9ff0a814... | 100 | 3 min. |
