Monitoring the progress of multiple jobs
You can profile multiple AWS Glue jobs together and monitor the flow of data between them. This is a common workflow pattern, and requires monitoring for individual job progress, data processing backlog, data reprocessing, and job bookmarks.
Topics
Profiled code
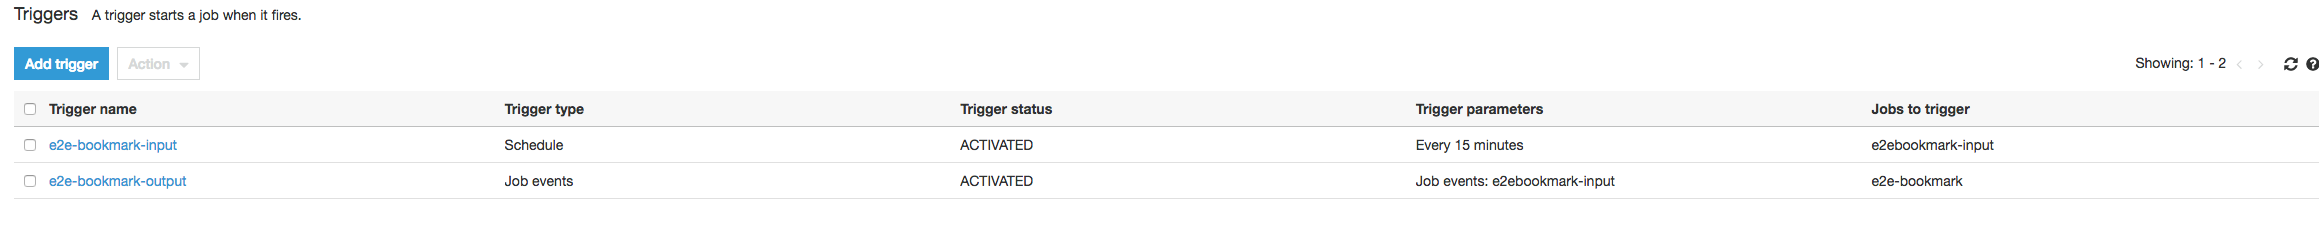
In this workflow, you have two jobs: an Input job and an Output job. The Input job is scheduled to run every 30 minutes using a periodic trigger. The Output job is scheduled to run after each successful run of the Input job. These scheduled jobs are controlled using job triggers.
Input job: This job reads in data from an Amazon Simple Storage Service (Amazon S3)
location, transforms it using ApplyMapping, and writes it to a staging Amazon S3
location. The following code is profiled code for the Input job:
datasource0 = glueContext.create_dynamic_frame.from_options(connection_type="s3", connection_options = {"paths": ["s3://input_path"], "useS3ListImplementation":True,"recurse":True}, format="json")
applymapping1 = ApplyMapping.apply(frame = datasource0, mappings = [map_spec])
datasink2 = glueContext.write_dynamic_frame.from_options(frame = applymapping1, connection_type = "s3", connection_options = {"path": staging_path, "compression": "gzip"}, format = "json")
Output job: This job reads the output of the Input job from the staging location in Amazon S3, transforms it again, and writes it to a destination:
datasource0 = glueContext.create_dynamic_frame.from_options(connection_type="s3", connection_options = {"paths": [staging_path], "useS3ListImplementation":True,"recurse":True}, format="json")
applymapping1 = ApplyMapping.apply(frame = datasource0, mappings = [map_spec])
datasink2 = glueContext.write_dynamic_frame.from_options(frame = applymapping1, connection_type = "s3", connection_options = {"path": output_path}, format = "json")
Visualize the profiled metrics on the AWS Glue console
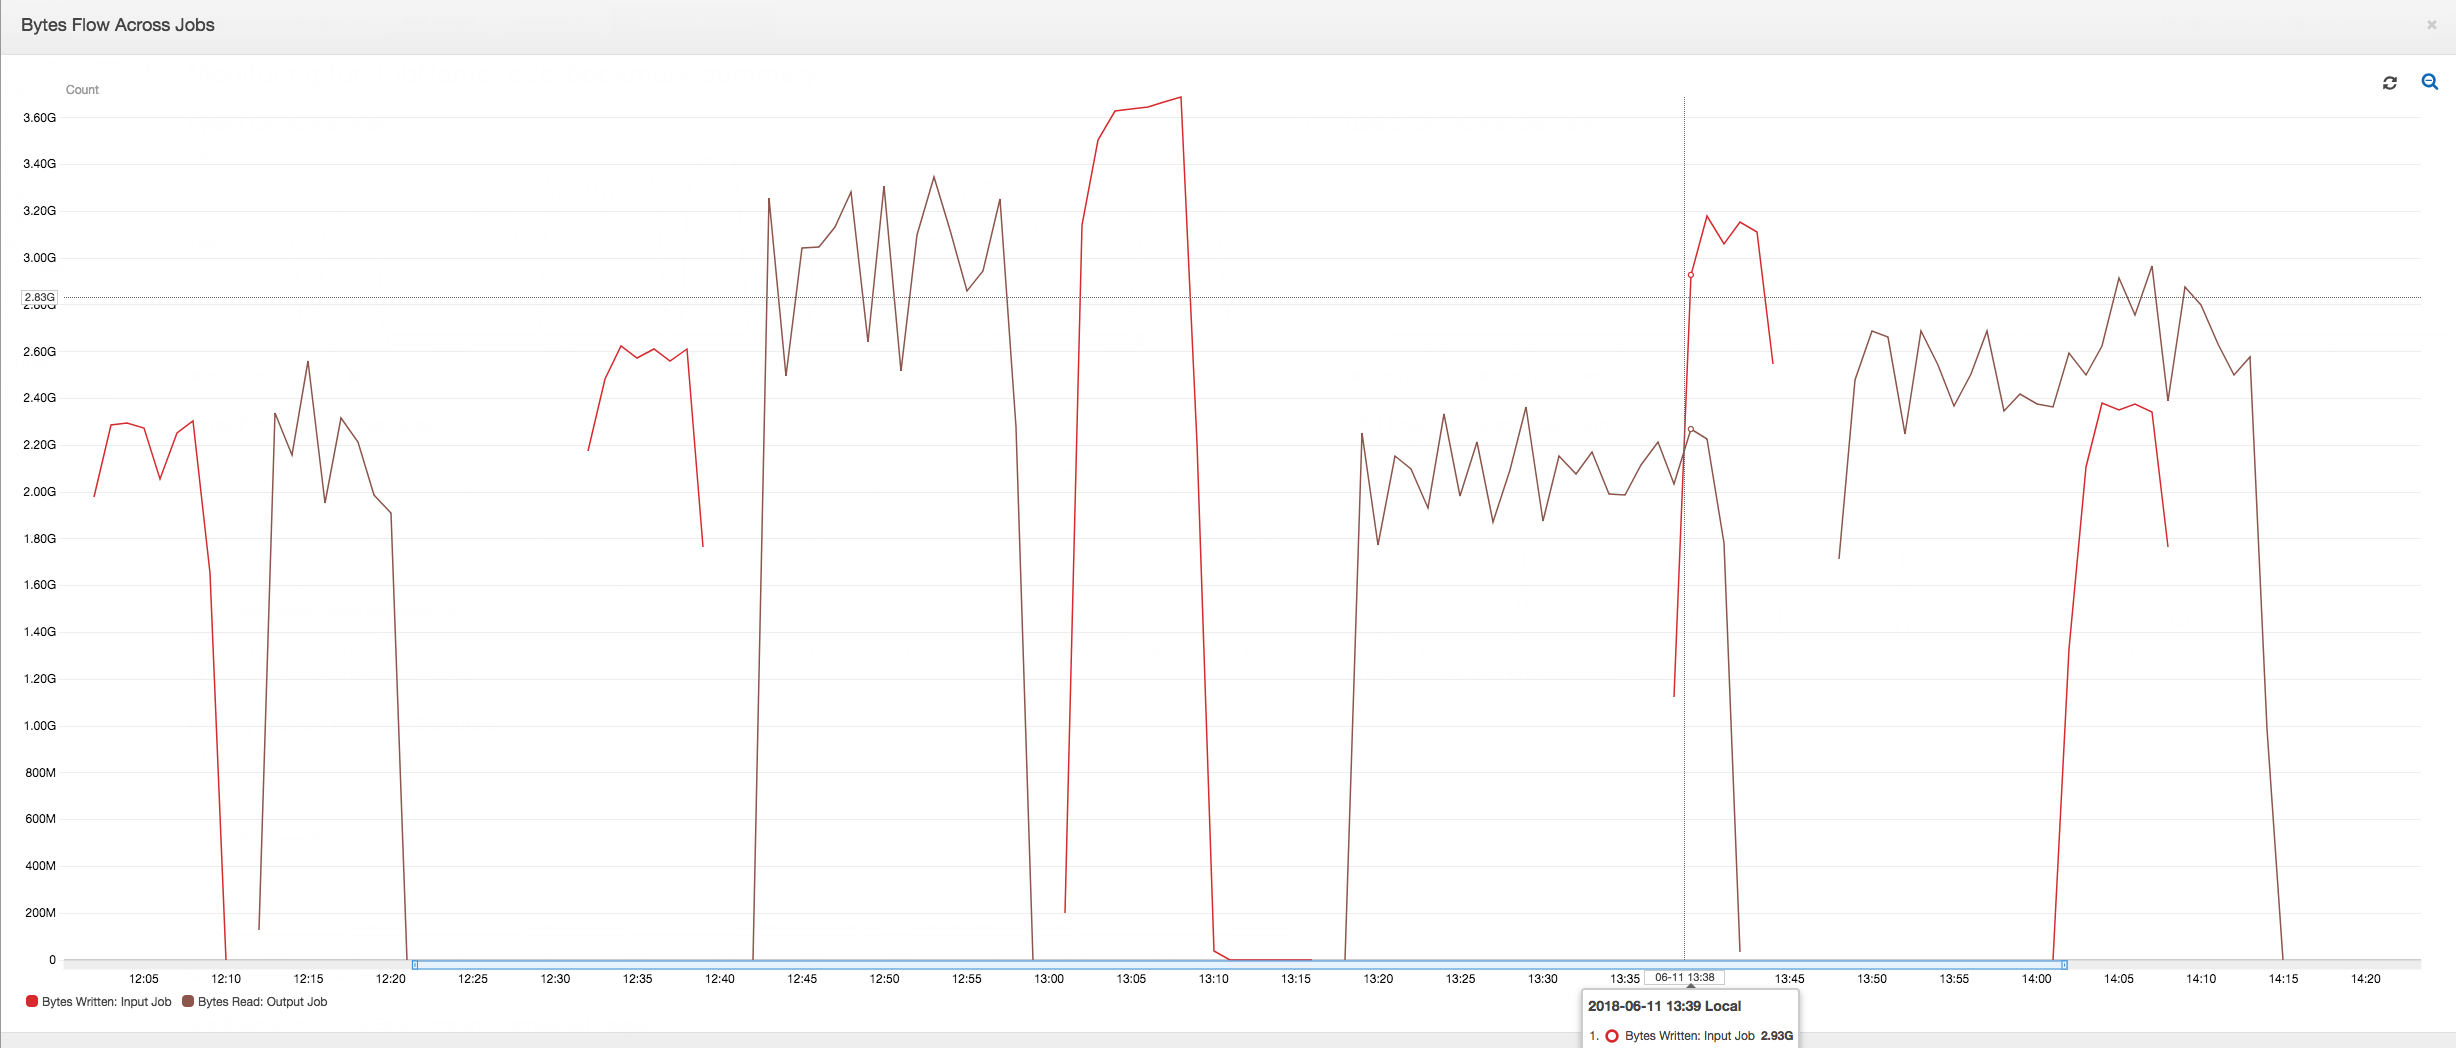
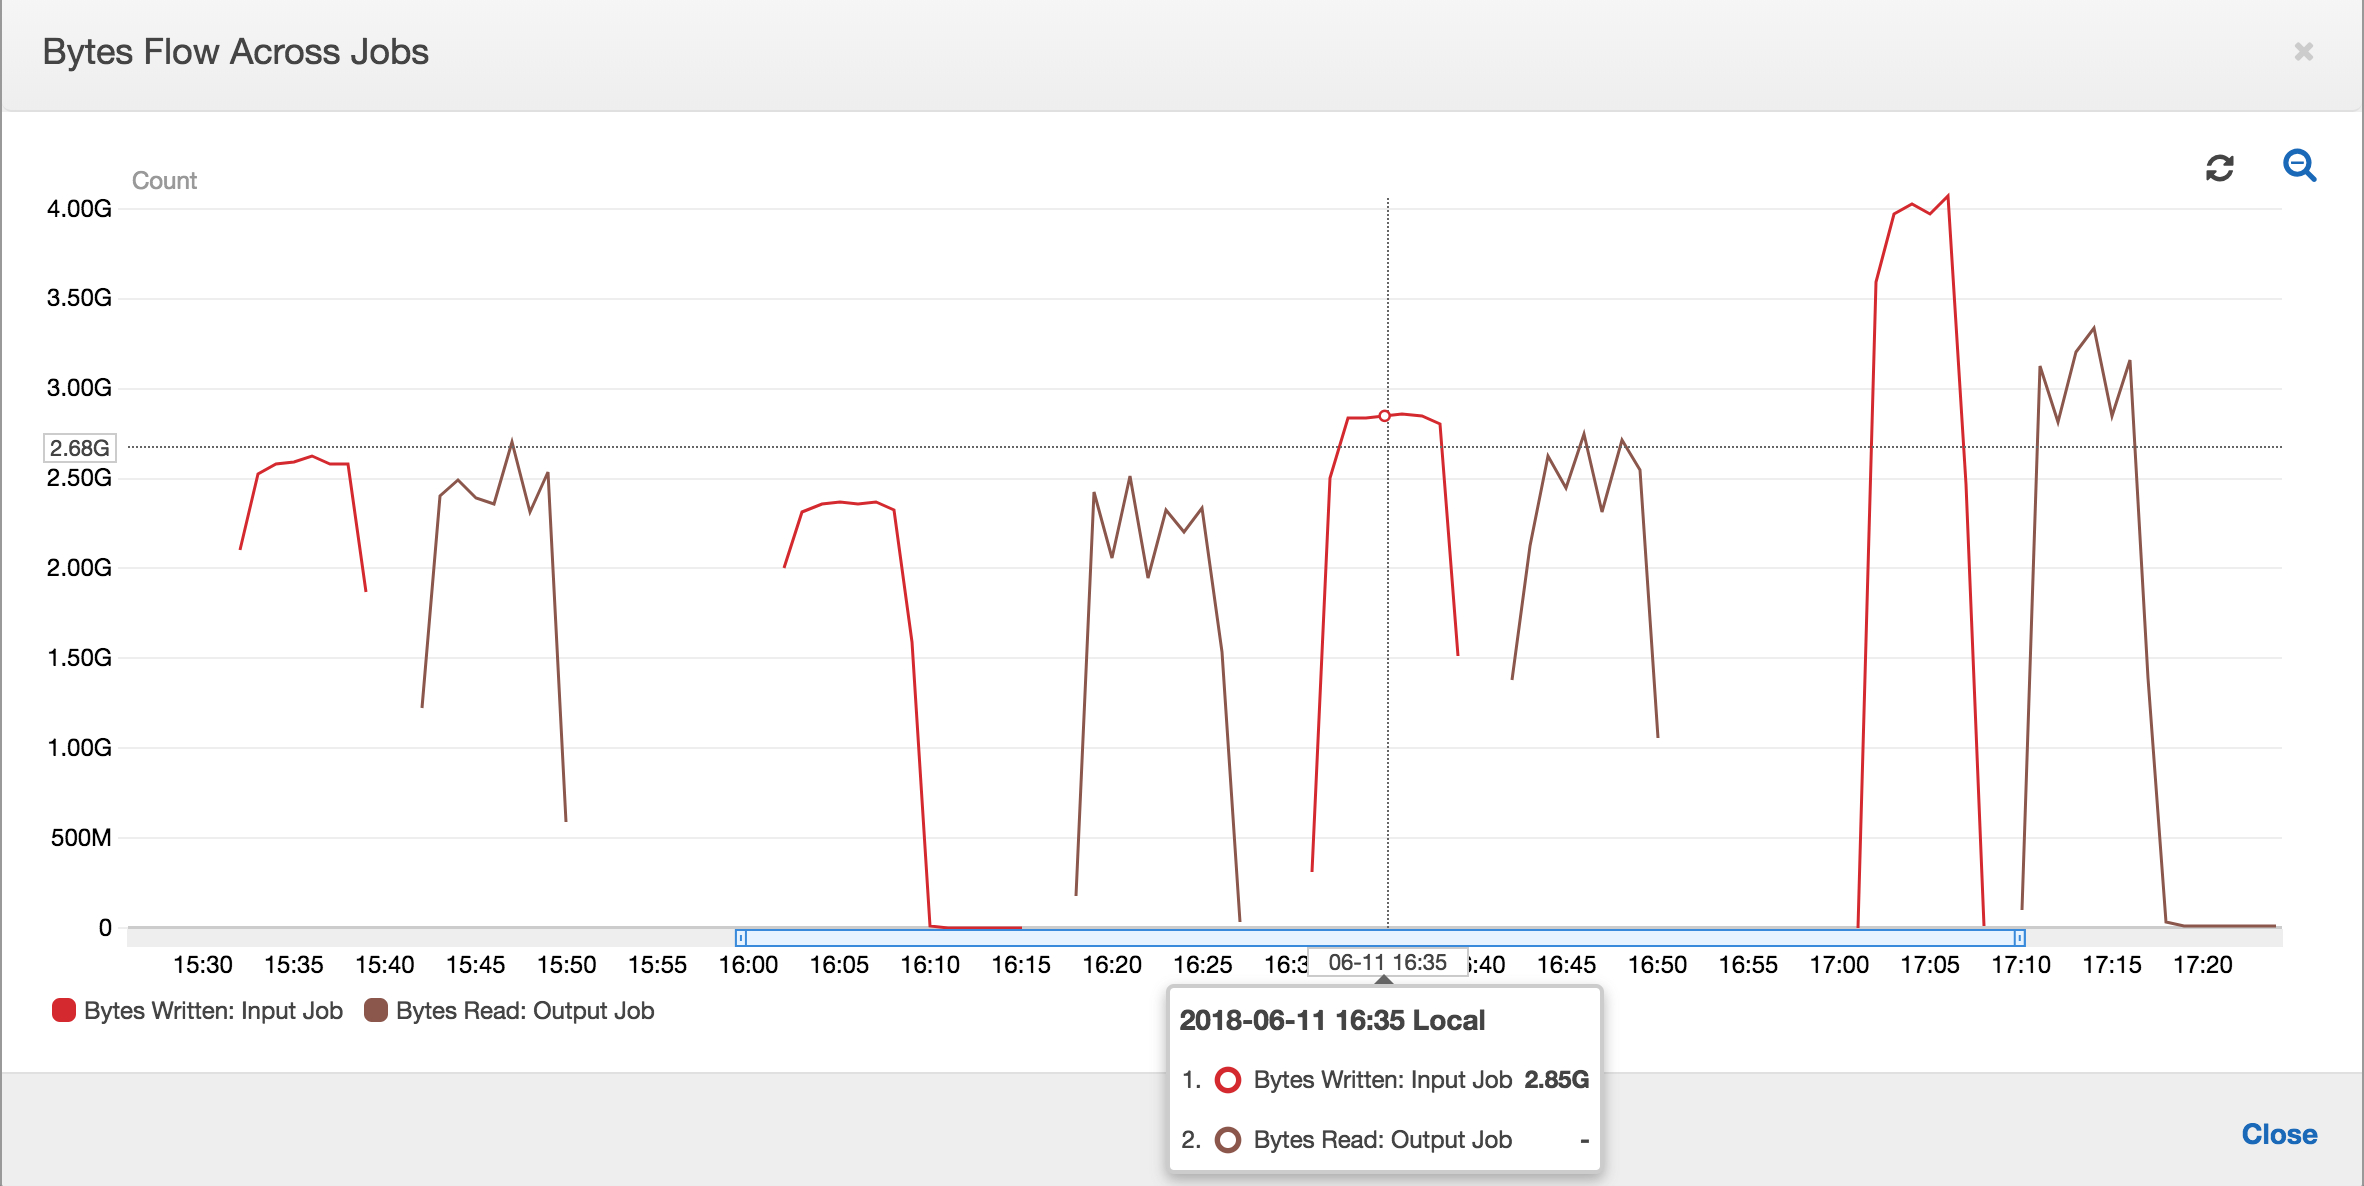
The following dashboard superimposes the Amazon S3 bytes written metric from the Input job onto the Amazon S3 bytes read metric on the same timeline for the Output job. The timeline shows different job runs of the Input and Output jobs. The Input job (shown in red) starts every 30 minutes. The Output Job (shown in brown) starts at the completion of the Input Job, with a Max Concurrency of 1.
In this example, job bookmarks are not enabled. No transformation contexts are used to enable job bookmarks in the script code.
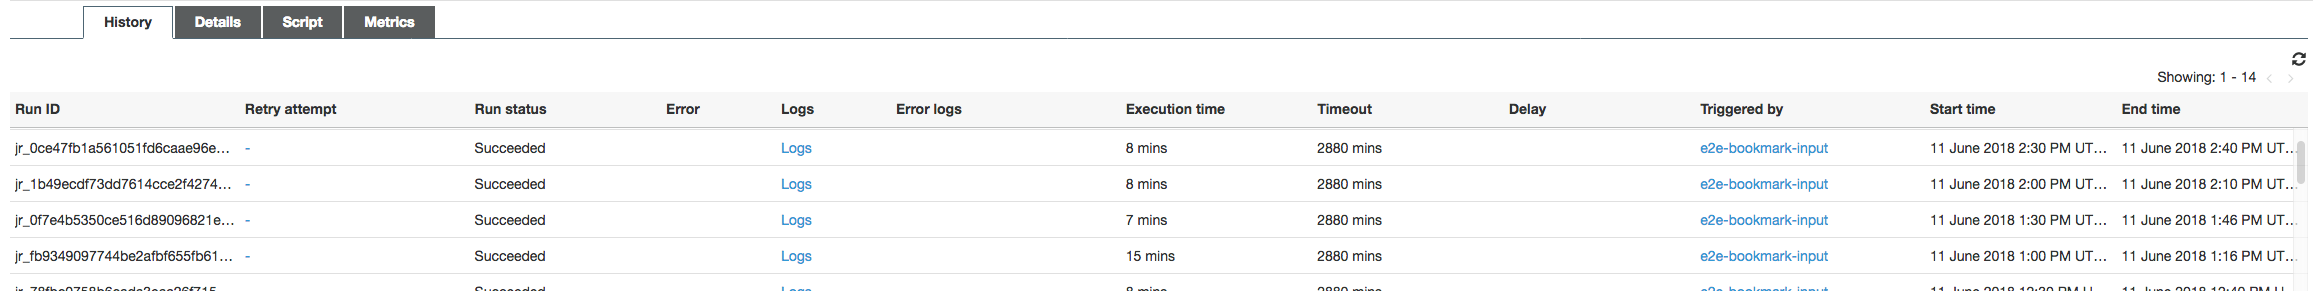
Job History: The Input and Output jobs have multiple runs, as shown on the History tab, starting from 12:00 PM.
The Input job on the AWS Glue console looks like this:
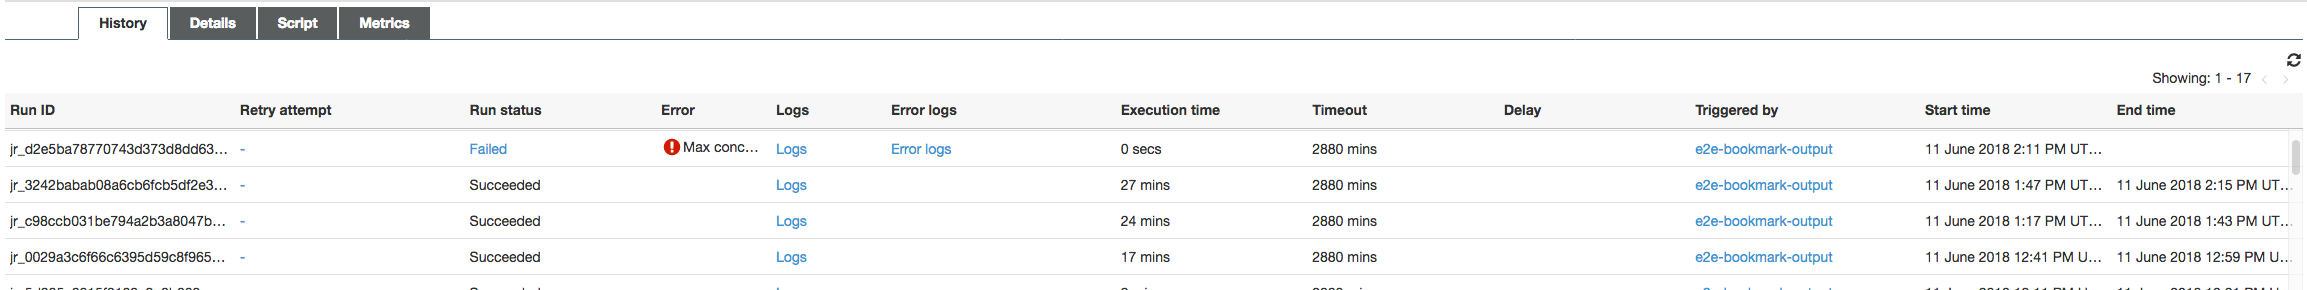
The following image shows the Output job:
First job runs: As shown in the Data Bytes Read and Written graph below, the first job runs of the Input and Output jobs between 12:00 and 12:30 show roughly the same area under the curves. Those areas represent the Amazon S3 bytes written by the Input job and the Amazon S3 bytes read by the Output job. This data is also confirmed by the ratio of Amazon S3 bytes written (summed over 30 minutes – the job trigger frequency for the Input job). The data point for the ratio for the Input job run that started at 12:00PM is also 1.
The following graph shows the data flow ratio across all the job runs:
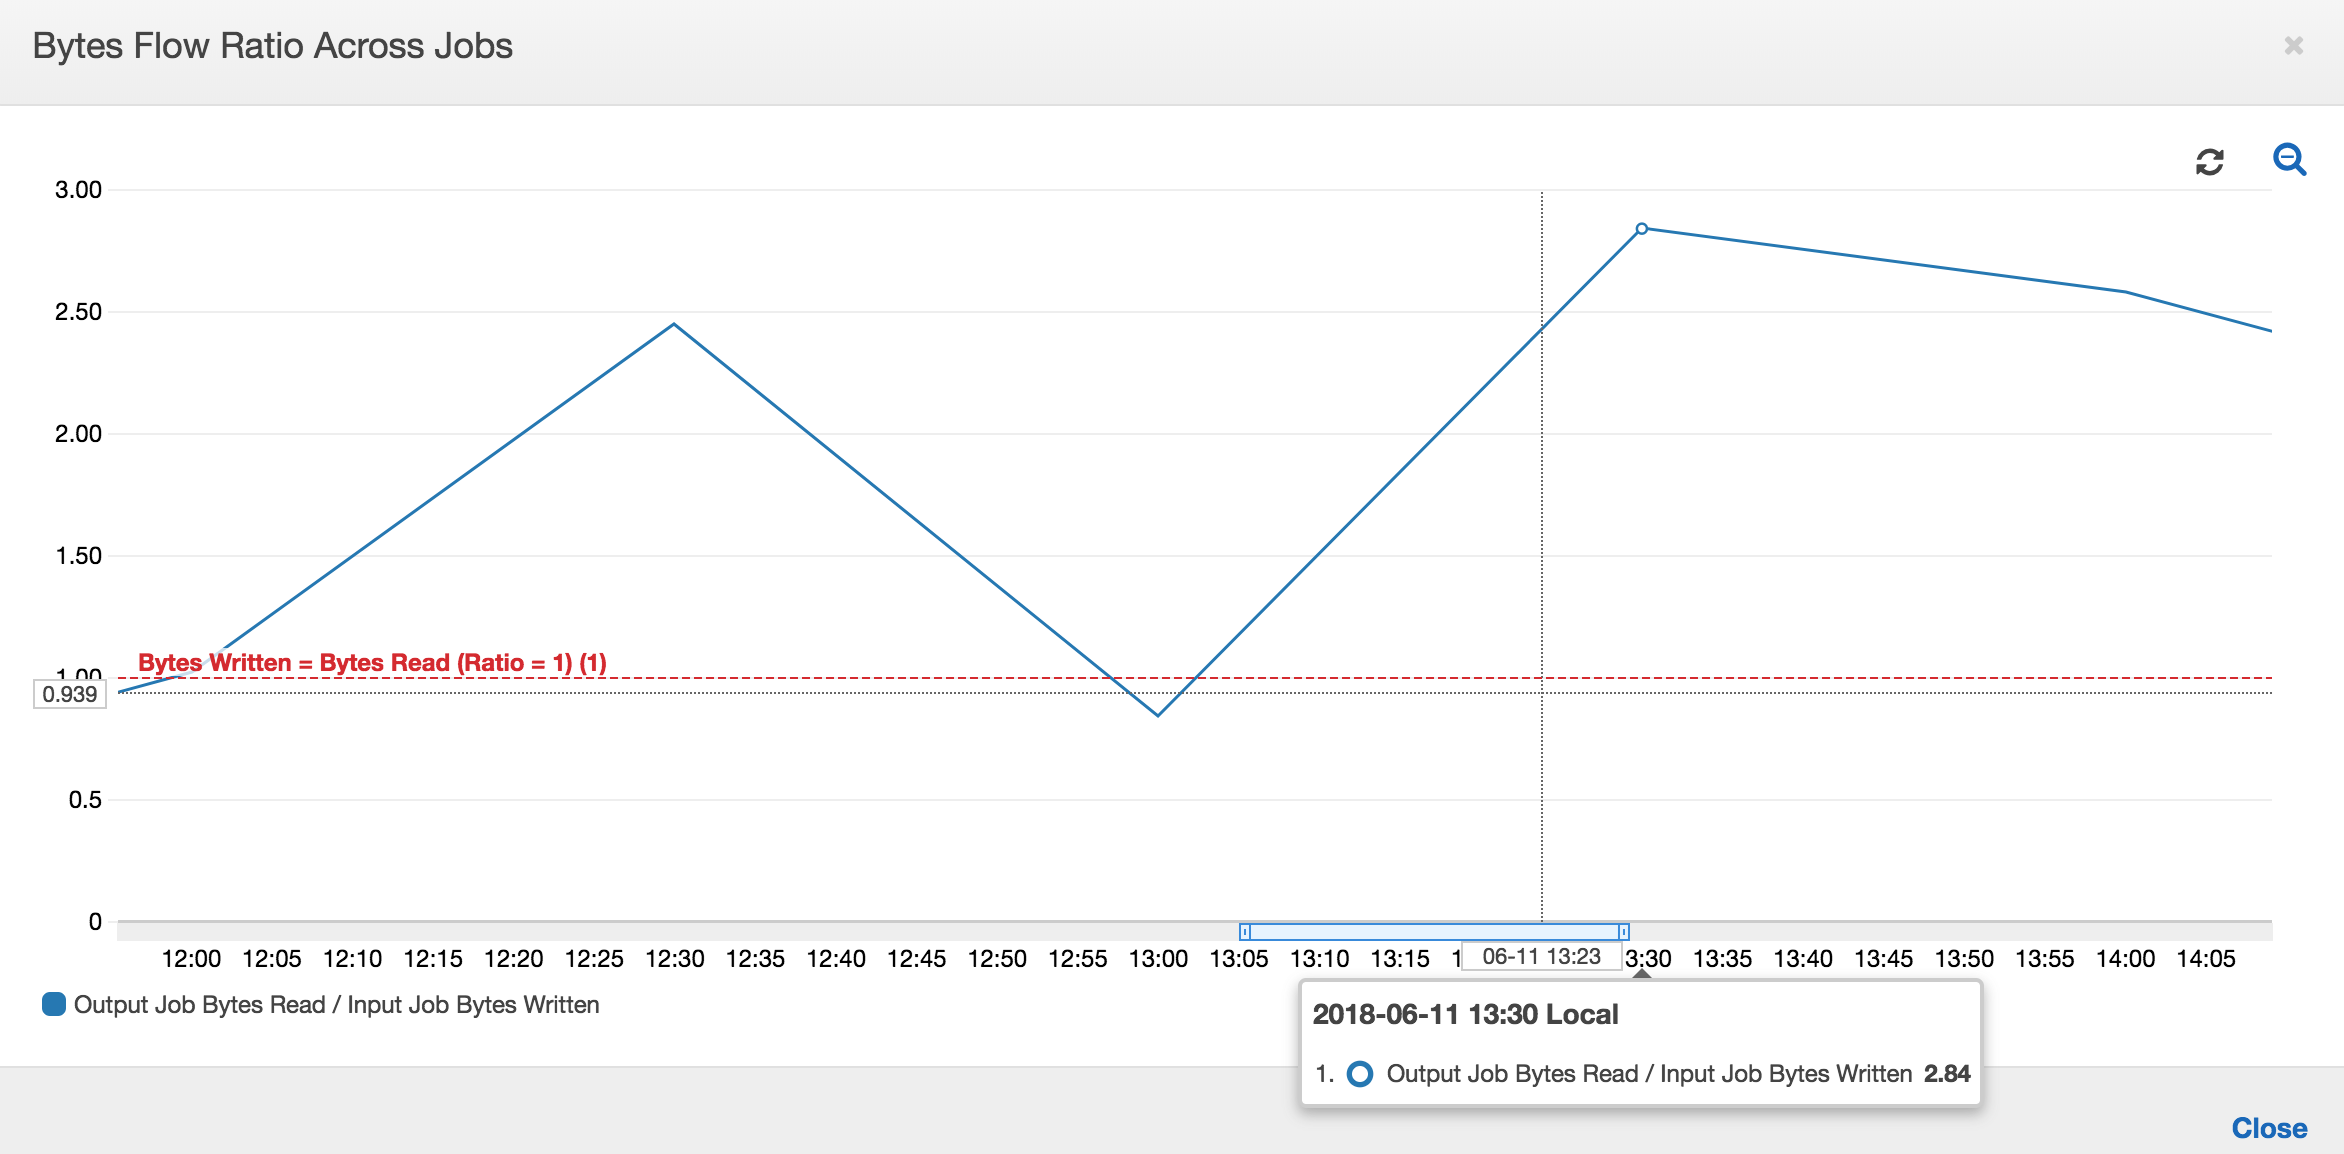
Second job runs: In the second job run, there is a clear difference in the number of bytes read by the Output job compared to the number of bytes written by the Input job. (Compare the area under the curve across the two job runs for the Output job, or compare the areas in the second run of the Input and Output jobs.) The ratio of the bytes read and written shows that the Output Job read about 2.5x the data written by the Input job in the second span of 30 minutes from 12:30 to 13:00. This is because the Output Job reprocessed the output of the first job run of the Input job because job bookmarks were not enabled. A ratio above 1 shows that there is an additional backlog of data that was processed by the Output job.
Third job runs: The Input job is fairly consistent in terms of the number of bytes written (see the area under the red curves). However, the third job run of the Input job ran longer than expected (see the long tail of the red curve). As a result, the third job run of the Output job started late. The third job run processed only a fraction of the data accumulated in the staging location in the remaining 30 minutes between 13:00 and 13:30. The ratio of the bytes flow shows that it only processed 0.83 of data written by the third job run of the Input job (see the ratio at 13:00).
Overlap of Input and Output jobs: The fourth job run of the Input job started at 13:30 as per the schedule, before the third job run of the Output job finished. There is a partial overlap between these two job runs. However, the third job run of the Output job captures only the files that it listed in the staging location of Amazon S3 when it began around 13:17. This consists of all data output from the first job runs of the Input job. The actual ratio at 13:30 is around 2.75. The third job run of the Output job processed about 2.75x of data written by the fourth job run of the Input job from 13:30 to 14:00.
As these images show, the Output job is reprocessing data from the staging location from all prior job runs of the Input job. As a result, the fourth job run for the Output job is the longest and overlaps with the entire fifth job run of the Input job.
Fix the processing of files
You should ensure that the Output job processes only the files that haven't been processed by previous job runs of the Output job. To do this, enable job bookmarks and set the transformation context in the Output job, as follows:
datasource0 = glueContext.create_dynamic_frame.from_options(connection_type="s3", connection_options = {"paths": [staging_path], "useS3ListImplementation":True,"recurse":True}, format="json", transformation_ctx = "bookmark_ctx")
With job bookmarks enabled, the Output job doesn't reprocess the data in the staging location from all the previous job runs of the Input job. In the following image showing the data read and written, the area under the brown curve is fairly consistent and similar with the red curves.
The ratios of byte flow also remain roughly close to 1 because there is no additional data processed.
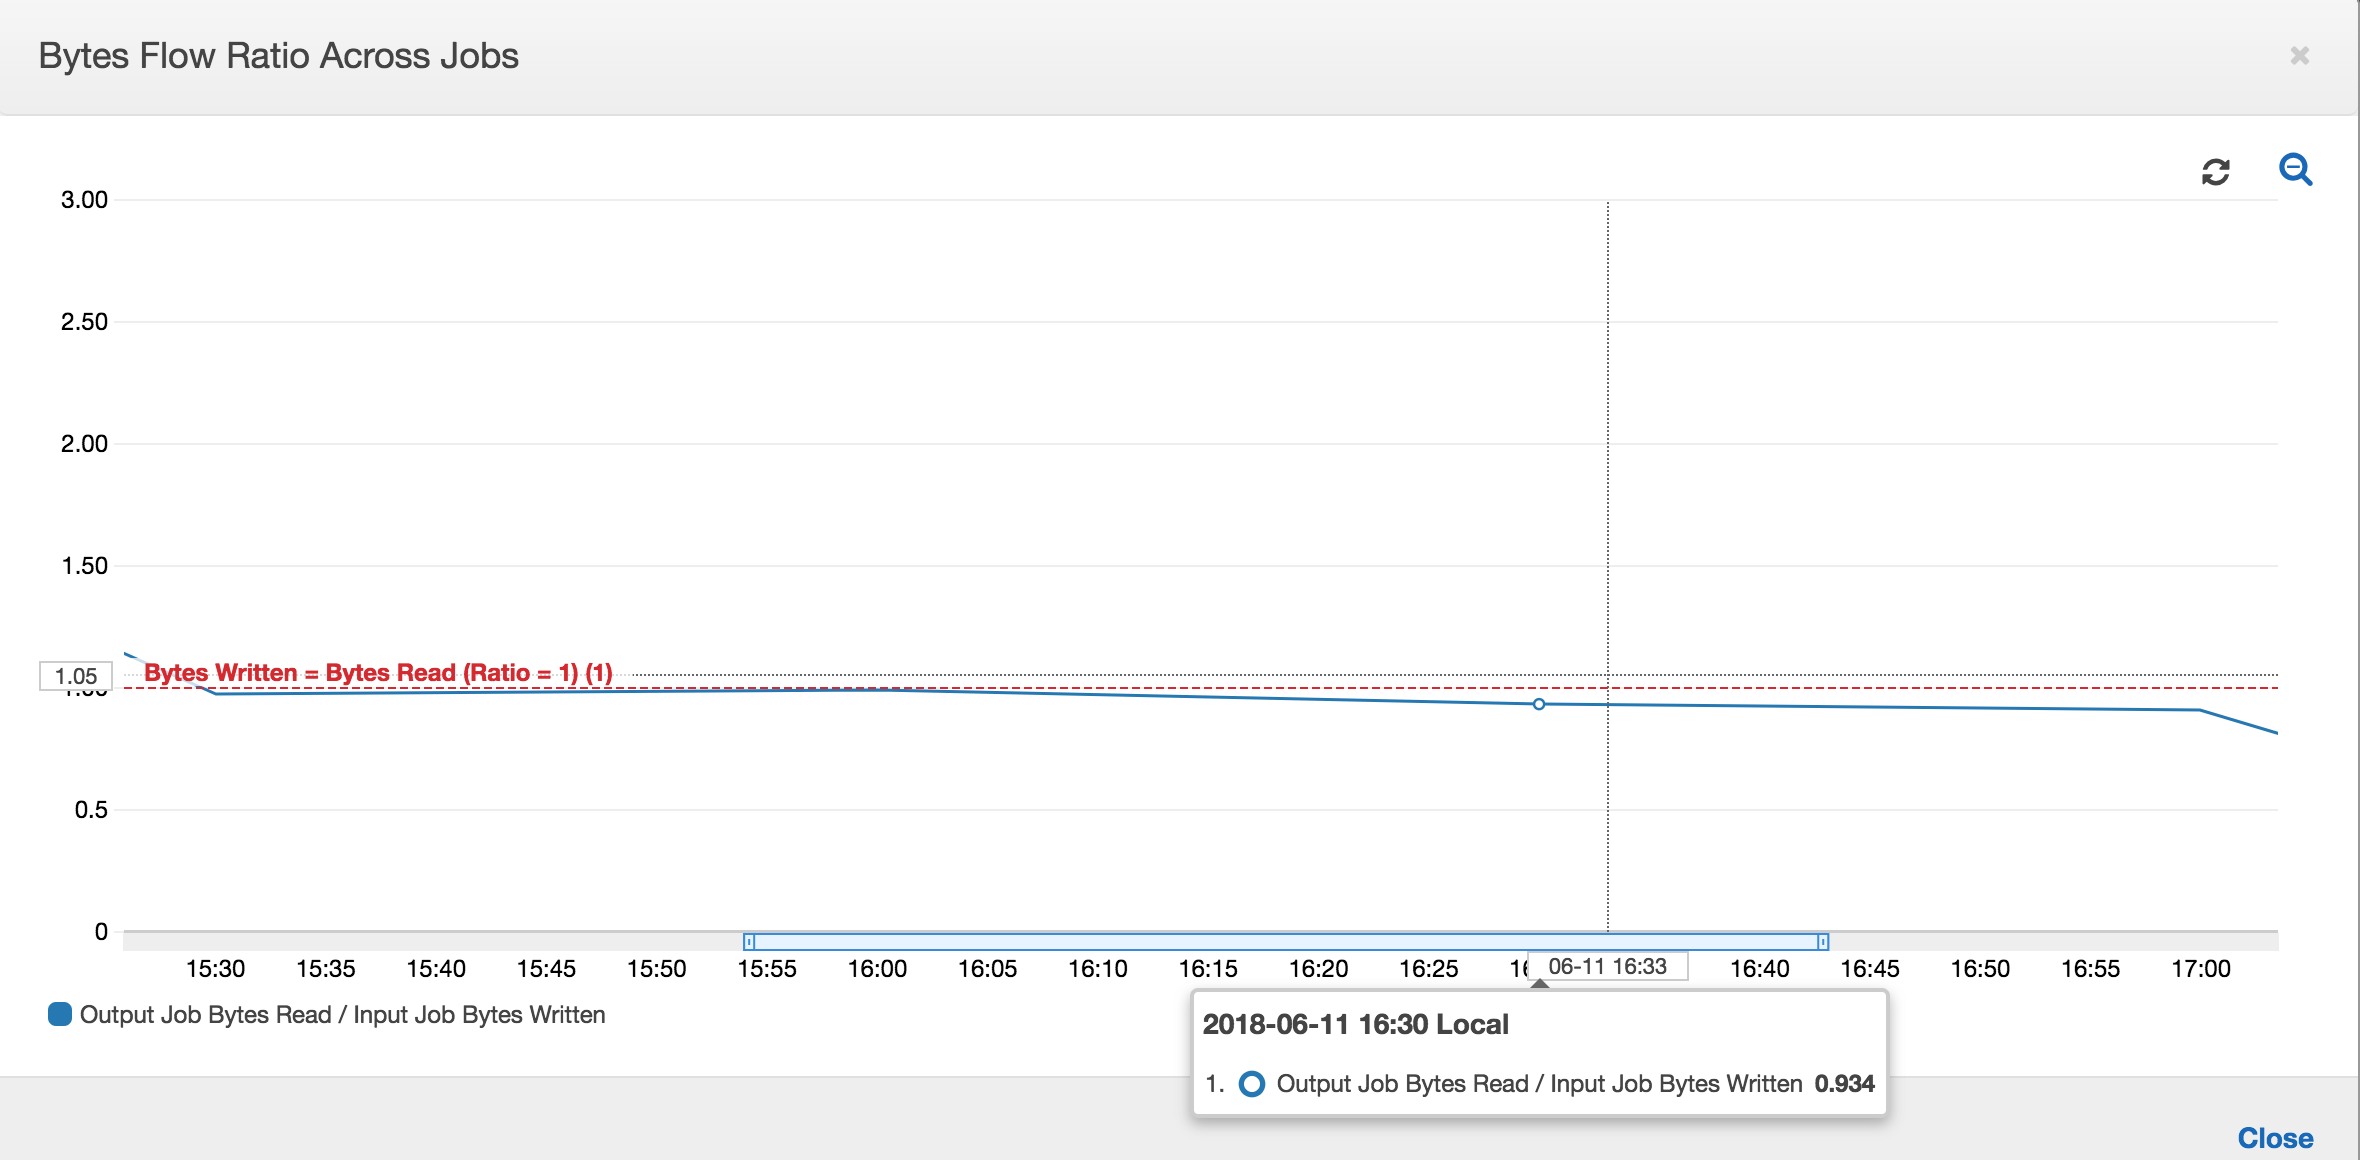
A job run for the Output job starts and captures the files in the staging location before the next Input job run starts putting more data into the staging location. As long as it continues to do this, it processes only the files captured from the previous Input job run, and the ratio stays close to 1.
Suppose that the Input job takes longer than expected, and as a result, the Output job captures files in the staging location from two Input job runs. The ratio is then higher than 1 for that Output job run. However, the following job runs of the Output job don't process any files that are already processed by the previous job runs of the Output job.
