Monitoring AWS Glue Spark jobs
Topics
Spark Metrics available in AWS Glue Studio
The Metrics tab shows metrics collected when a job runs and profiling is turned on. The following graphs are shown in Spark jobs:
ETL Data Movement
Memory Profile: Driver and Executors
Choose View additional metrics to show the following graphs:
ETL Data Movement
Memory Profile: Driver and Executors
Data Shuffle Across Executors
CPU Load: Driver and Executors
Job Execution: Active Executors, Completed Stages & Maximum Needed Executors
Data for these graphs is pushed to CloudWatch metrics if the job is configured to collect metrics. For more information about how to turn on metrics and interpret the graphs, see Job monitoring and debugging.
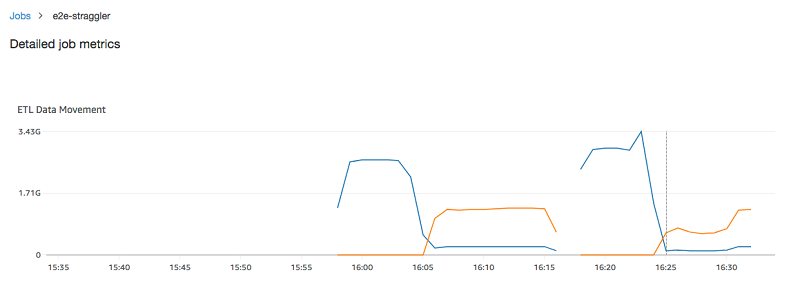
Example ETL data movement graph
The ETL Data Movement graph shows the following metrics:
The number of bytes read from Amazon S3 by all executors—glue.ALL.s3.filesystem.read_bytes
-
The number of bytes written to Amazon S3 by all executors—glue.ALL.s3.filesystem.write_bytes
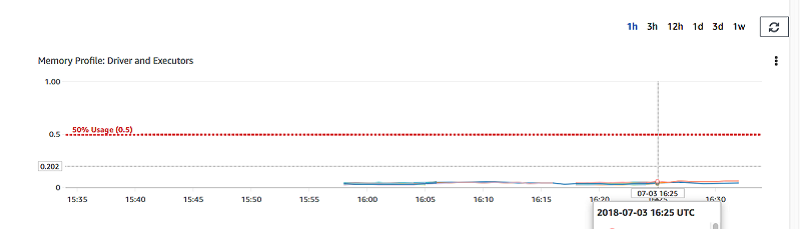
Example Memory profile graph
The Memory Profile graph shows the following metrics:
The fraction of memory used by the JVM heap for this driver (scale: 0–1) by the driver, an executor identified by executorId, or all executors—
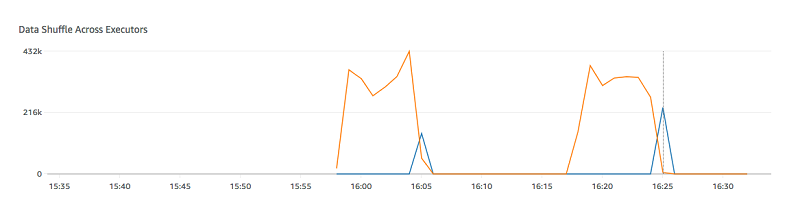
Example Data shuffle across executors graph
The Data Shuffle Across Executors graph shows the following metrics:
The number of bytes read by all executors to shuffle data between them—glue.driver.aggregate.shuffleLocalBytesRead
-
The number of bytes written by all executors to shuffle data between them—glue.driver.aggregate.shuffleBytesWritten
Example CPU load graph
The CPU Load graph shows the following metrics:
The fraction of CPU system load used (scale: 0–1) by the driver, an executor identified by executorId, or all executors—

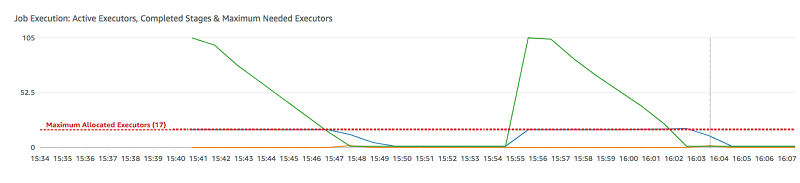
Example Job execution graph
The Job Execution graph shows the following metrics:
The number of actively running executors—glue.driver.ExecutorAllocationManager.executors.numberAllExecutors
The number of completed stages—glue.aggregate.numCompletedStages
The number of maximum needed executors—glue.driver.ExecutorAllocationManager.executors.numberMaxNeededExecutors