Zabbix
Note
In workspaces that support version 9 or newer, this data source might require you to install the appropriate plugin. For more information, see Grafana plugins.
With Zabbix data source for Grafana, you can visualize monitoring data from Zabbix and create dashboards for analyzing metrics and real-time monitoring. Using Grafana Zabbix plugin features, you can create dashboards to monitor data visualization in a quick and powerful way.
Enable the Zabbix plugin
-
Choose the Configuration (gear) icon on the left side bar and select Plugins.
-
Select Zabbix in the dropdown list or search for it by ntering
Zabbixin the search field. -
Select Zabbix and choose the Config tab.
-
Select Enable.
Configure the Zabbix data source
-
After you enable the plugin, choose the Configuration (gear) icon and select Data sources. Select Zabbix from the list of search results.
-
In the Settings window, complete the HTTP settings section as follows:
-
For URL, enter the Zabbix API URL. For example,
https://zabbix.grafana-zabbix.org/api_jsonrpc.php. -
Keep Access set to
Server. -
Configure AUTH if you use proxy authentication.
-
-
In the Zabbix API details section, complete the fields as follows:
-
Username and Password: Set up a username and password for access to the Zabbix API. Also check the user permissions in Zabbix if you cannot get any groups or hosts in Grafana.
-
Turn on Trends if you use Zabbix 3 or newer. This option is strictly recommended for displaying long time periods (more than a few days, depending on your item's updating interval in Zabbix). A few days of item history contains a lot of points. Using trends increases Grafana's performance.
-
For After, choose the time after which the trends will be used. We recommend setting this value to your history storage period (for example, 7d or 30d). Default is
7d(7 days). You can set the time in Grafana format. Valid time specifications are as follows:-
h- hours -
d- days -
M- months
-
-
For Range, set the time range width. This indicates when to start using trends instead of history. It's better to set this value in a range of 4–7 days to prevent loading a large amount of history data. Default is 4 days.
-
For Cache TTL, set a value for the desired cache lifetime. The plugin caches some API requests to increase performance. This option affects data like the items list.
-
For Timeout, set the Zabbix connection timeout in seconds. Default is 30.
-
-
Direct DB Connection
In the Direct DB Connection section, complete the fields as in the Step 2.
Direct DB Connection allows plugin to use existing SQL data source for querying history data directly from Zabbix database. This way usually faster than pulling data from Zabbix API, especially on the wide time ranges, and reduces amount of data transferred.
For more information about direct DB connection, see Direct DB Data source configuration
. -
Enable: Enable Direct DB connection.
-
-
Supported databases
MySQL, PostgreSQL, InfluxDB are supported as sources of historical data for the Zabbix plugin.
-
Other
-
Disable acknowledges for read-only users: Disable ability to acknowledge problems from Grafana for non-editors.
-
Disable data alignment: Disable time series data alignment. This feature aligns points based on item update interval. For instance, if a value is collected once per minute, then the timestamp of each point will be set to the start of the corresponding minute. This alignment is required for proper work of the stacked graphs. If you don't need stacked graphs and want to get exactly the same timestamps as in Zabbix, then you can disable this feature. Also, data alignment can be toggled for each query individually, in the query options.
-
-
Go to Save & Test.
Getting started with Zabbix
After you added Zabbix in Amazon Managed Grafana as a data source, let's create a simple dashboard.
Simple graph
Add a new Graph panel to a dashboard. Select metrics from the dropdown list or start to type to filter results.
You can also create a 15 minute average processor load graph. Select Host
Group, Host, Application (optional - you can leave
it blank), and Item.
Multiple items on one graph
You can build graphs with many items using Regular Expressions inside the metric
field. Amazon Managed Grafana uses JavaScript regex implementation. For example, if you need
to show CPU time (user, system,
or iowait) you can create the graph by using this regex in the
Item field.
/CPU (?!idle).* time/
Another case to use regex is comparing the same metrics for different hosts. Use
/.*/ regex to show all metrics, or write your own filter. For example,
to show the CPU system time for all hosts whose name started with the backend from all
host groups, use /.*/ for Group, /^backend/
for Host, and CPU system time for
Item.
Bar chart
To create a graph which show queries stats for
MySQL database, select Group,
Host, Application
(MySQL in my case) and Items. Use /MySQL .*
operations/ regex for filtering different types of operations.
To show graph as Bar Chart, go to the Display tab, uncheck Lines and set Bars. Also, enable Stack checkbox for showing stacked bars.
You can adjust the Max data points by going to Metrics tab and setting the Max data points to the desired level.
Singlestat and Gauges
To show just a big single value for a particular metric, use the Amazon Managed Grafana
Singlestat panel. To create a panel which shows the CPU
user time metric, go to Singlestat panel and select the
CPU user time metric.
If you want to set units as percents and show Gauge for this value, go to the Options tab and set units to percent (0-100). Then enable Show option for Gauge and set Min and Max values for your metric (0-100 in this case). Set Thresholds if you want to see it on Gauge (for example, 50, 80).
Features
-
Multiple metrics – Select multiple metrics by using regular expressions.
-
Template variables – Create interactive and reusable dashboards with template variables.
-
Annotations – Show events on graphs with Annotations.
-
Triggers panel – Display active problems with Triggers panel.
-
Metric processing functions – Transform and shape your data with metric processing functions Avg, Median, Min, Max, Multiply, Summarize, Timeshift, Alias)
. -
Alerting feature – Find problems faster with the Alerting feature. See Grafana alerting.
-
Mix metrics – Mix metrics from multiple data sources in the same dashboard or even graph.
-
Library feature – Discover and share dashboards in the official library.
Templating
You can use template variables for creating highly reusable and interactive
dashboards. The purpose of templating is to allow Grafana to get different metrics from
the data source and provide a way to change it on the fly without modifying dashboards.
In Zabbix, you can get a list of Host Groups, Applications, or
Items and add it as a variable.
Templating a variable
To template a variable, choose the gear icon on the top navigation bar and choose Templating, new.
Variable
- Name
-
Name of the variable. You should use this name in queries.
- Label
-
Visible label for variable. Use when you want to display different name on dashboard. For instance,
Host Groupinsteadhost_group. - Type
-
By default,
Querytype is selected. It means that Grafana asks data source for values of variable. But there are some other types:Interval(just a time interval),Data source(you can switch data source, for example, if you have more than one Zabbix instance and each added into Grafana as data source),Custom(you can set any predefined values for the variable), andConstant.
Query options
- Data source
-
Data source used for querying variable values.
- Refresh
-
Update frequency for the values of this variable.
- Query
-
Query string.
- Regex
-
Use regex if you need to filter values or extract a part of value.
Selection options
- Multi-value
-
Select multiple values at the same time.
- Value groups and tags
-
This feature is in development.
Query format
The template variable query in Zabbix data source is a string which contains 4 parts
wrapped in braces ({}). You still can use a period (.), but
it's discontinued and will be removed in future.
{host group}{host}{application}{item name}
The following example demonstrates the query format for Zabbix.
{Zabbix servers}{Zabbix server}{CPU}{*}
{Frontend}{web01.mydomain.com}{*}{*}
Each part can be a name of a corresponding metric or an asterisk (*),
which means all metrics.
Examples include the following:
-
{*}returns list of all available host groups. -
{*}{*}returns all hosts in Zabbix. -
{Network}{*}returns all hosts in the group network. -
{Linux servers}{*}{*}returns all applications from hosts in Linux servers group. -
{Linux servers}{backend01}{CPU}{*}returns all items from backend01 belonging to the CPU application.
You can use another variable as a part of the query. For instance, you have a
variable group, which returns a list of host groups. You want to use
this to query hosts in a selected group only. Here's a query for this case:
{$group}{*}
Variables usage
When you create a variable, you can use it as a part of the data source query. Grafana also supports variables in different places like panel and row titles and Text panel content.
The following sample chart uses $group and $host
variables.
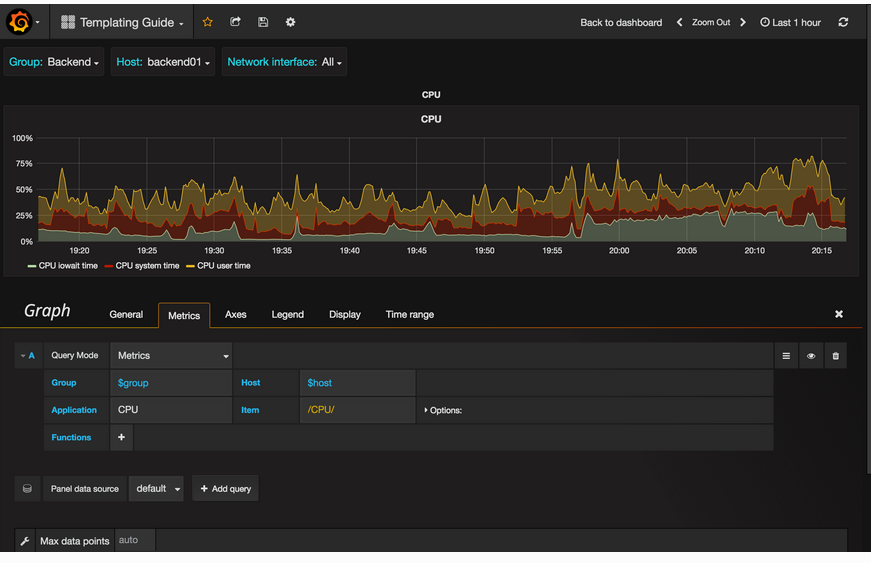
You should add a $ sign before a variable's name ($host for host
variable).
