Geomap
This documentation topic is designed for Grafana workspaces that support Grafana version 10.x.
For Grafana workspaces that support Grafana version 9.x, see Working in Grafana version 9.
For Grafana workspaces that support Grafana version 8.x, see Working in Grafana version 8.
Geomaps allow you to view and customize the world map using geospatial data. You can configure various overlay styles and map view settings to easily focus on the important location-based characteristics of the data.
Note
You can add your own geospatial data on top of basemap layers provides by AWS.
The basemap layers must all come from https://tiles.maps.search-services.aws.a2z.com

Map View
The map view controls the initial view of the map when the dashboard loads.
Initial View
The initial view configures how the GeoMap panel renders when the panel is first loaded.
-
View sets the center for the map when the panel first loads.
-
Fit to data fits the map view based on the data extents of Map layers and updates when data changes.
-
Data option allows selection of extent based on data from All layers, a single Layer, or the Last value from a selected layer.
-
Layer can be selected if fitting data from a single Layer or the Last value of a layer.
-
Padding sets padding in relative percent beyond data extent (not available when looking at Last value only).
-
Max Zoom sets the maximum zoom level when fitting data.
-
-
Coordinates sets the map view based on:
-
Latitude
-
Longitude
-
-
Default views are also available including:
-
(0°, 0°)
-
North America
-
South America
-
Europe
-
Africa
-
West Asia
-
South Asia
-
South-East Asia
-
East Asia
-
Australia
-
Oceania
-
-
-
Zoom sets the initial zoom level.
Map layers
Geomaps support showing multiple layers. Each layer determines how you visualize geospatial data on top of the base map.
Types
There are three map layer types to choose from in the Geomap visualization.
-
Markers layer renders a marker at each data point.
-
Heatmap layer visualizes a heatmap of the data.
-
GeoJSON layer renders static data from a GeoJSON file.
-
Night / Day layer (Alpha) renders a night or day region.
-
Route layer (preview) render data points as a route.
-
Photos layer (preview) renders a photo at each data point.
-
Network layer (preview) visualizes a network graph from the data.
There are also two experimental (or alpha) layer types.
-
Icon at last point (alpha) renders an icon at the last data point.
-
Dynamic GeoJSON (alpha) styles a GeoJSON file based on query results.
Note
Layers marked preview or alpha in public preview. Grafana Labs offers limited support, and breaking changes might occur prior to the feature being made generally available.
Layer Controls
The layer controls allow you to create layers, change their name, reorder and delete layers.
-
Add layer creates an additional, configurable data layer for the geomap. When you add a layer, you are prompted to select a layer type. You can change the layer type at any point during panel configuration.
-
The layer controls allow you to rename, delete, and reorder the layers of the panel.
-
Edit layer name (pencil icon) renames the layer.
-
Trash Bin deletes the layer.
-
Reorder (six dots/grab handle) allows you to change the layer order. Data on higher layers will appear above data on lower layers. The visualization will update the layer order as you drag and drop to help simplify choosing a layer order.
-
You can add multiple layers of data to a single geomap panel in order to create rich, detailed visualizations.
Location
Geomaps needs a source of geographical data. This data comes from a database query, and there are four mapping options for your data.
-
Auto automatically searches for location data. Use this option when your query is based on one of the following names for data fields.
-
geohash:
geohash -
latitude:
latitude,lat -
longitude:
longitude,lng,lon -
lookup:
lookup
-
-
Coords specifies that your query holds coordinate data. You will getprompted to select numeric data fields for latitude and longitude from your database query.
-
Geohash specifies that your query holds geohash data. You will be prompted to select a string data field for the geohash from your database query.
-
Lookup specifies that your query holds location name data that needs to be mapped to a value. You will be prompted to select the lookup field from your database query and a gazetteer. The gazetteer is the directory that is used to map your queried data to a geographical point.
Markers layer
The markers layer allows you to display data points as different marker shapes such as circles, squares, triangles, stars, and more.
Markers have many customization options.
-
Size configures the size of the markers. The default is
Fixed size, which makes all marker sizes the same regardless of the data; however, there is also an option to size the markers based on the data corresponding to selected field.MinandMaxmarker size has to be set such that the Marker layer can scale within this range. -
Symbol allows you to choose the symbol, icon, or graphic to aid in providing additional visual context to your data. Choose from assets that are included with Grafana such as simple symbols or the Unicon library. You can also specify a URL containing an image asset. The image must be a scalable vector graphic (SVG).
-
Symbol Vertical Align configures the vertical alignment of the symbol relative to the data point. Note that the symbol's rotation angle is applies first around the data point, then the vertical alignment is applied relative to the rotation of the symbol.
-
Symbol Horizontal Align configures the horizontal alignment of the symbol relative to the data point. Note that the symbol's rotation angle is applies first around the data point, then the horizontal alignment is applied relative to the rotation of the symbol.
-
Color configures the color of the markers. The default
Fixed colorsets all markers to a specific color. There is also an option to have conditional colors depending on the selected field data point values and the color scheme set at the Standard options section. -
Fill opacity configures the transparency of each marker.
-
Rotation angle configures the rotation angle of each marker. The default is Fixed value, which makes all markers rotate to the same angle regardless of the data; however, there is also an option to set the rotation of the markers based on data corresponding to a selected field.
-
Text label configures a text label for each marker.
-
Show legend lets you toggle the legend for the layers.
-
Display tooltip lets you toggle tooltips for the layer.
Heatmap layer
The heatmap layer clusters various data points to visualize locations with different densities.

To add a heatmap layer:
Choose on the dropdown menu under Data Layer and select Heatmap.
Similar to Markers, you are prompted with options to
determine which data points to visualize and how you want to visualize
them.
-
Weight values configure the intensity of the heatmap clusters. Fixed value keeps a constant weight value throughout all data points. This value should be in the range of 0-1. Similar to Markers, there is an alternate option in the dropdown to automatically scale the weight values depending on data values.
-
Radius configures the size of the heatmap clusters.
-
Blur configures the amount of blur on each cluster.
-
Opacity configures the opacity of each cluster.
-
Display tooltip lets you toggle tooltips for the layer.
GeoJSON layer
The GeoJSON layer allows you to select and load a static GeoJSON file from the filesystem.
-
GeoJSON URL provides a choice of GeoJSON files that ship with Grafana.
-
Default Style controls which styles to apply when no rules above match.
-
Color configures the color of the default style
-
Opacity configures the default opacity
-
-
Style Rules apply styles based on feature properties
-
Rule allows you to select a feature, condition, and value from the GeoJSON file in order to define a rule. The trash bin icon can be used to delete the current rule.
-
Color configures the color of the style for the current rule
-
Opacity configures the transparency level for the current rule.
-
-
Add style rule creates additional style rules.
-
Display tooltip lets you toggle tooltips for the layer.
Night / Day layer (Alpha)
The Night / Day layer displays night and day regions based on the current time range.

Options
-
Show toggles the time source from panel time range.
-
Night region color picks the color for the night region.
-
Display sun toggles sun icon.
-
Opacity from 0 (transparent) to 1 (opaque).
-
Display tooltip lets you toggle tooltips for the layer.
Note
For more information, see Extensions for OpenLayers - DayNight
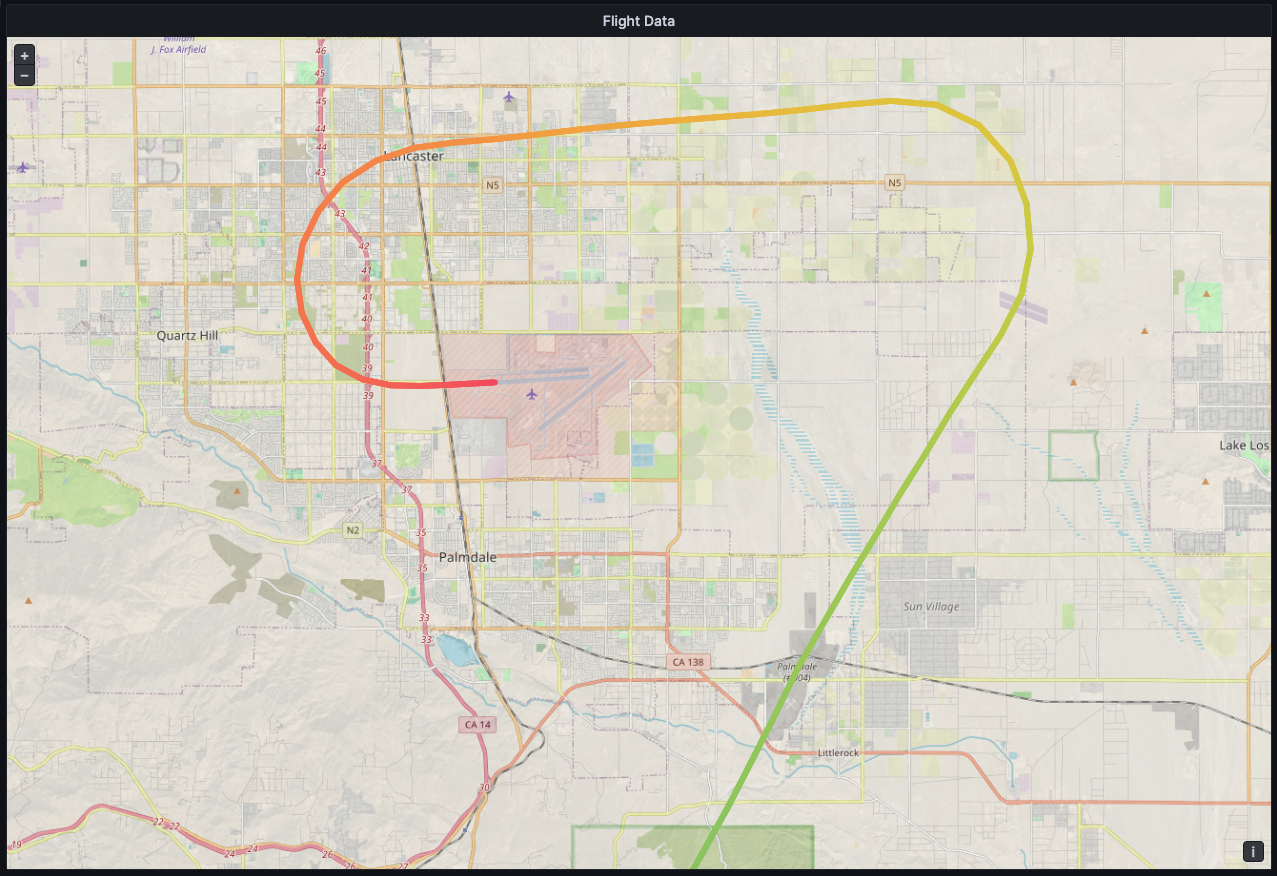
Route layer (preview)
The Route layer renders data points as a route.
Note
The Route layer is currently in public preview. Grafana Labs offers limited support, and breaking changes might occur prior to the feature being made generally available.
Options
-
Size sets the route thickness. Fixed value by default. When field data is selected, you can set the Min and Max range in which field data can scale.
-
Color sets the route color. Set to fixed color by default, you can also tie the color to field data.
-
Fill opacity configures the opacity of the route.
-
Text label configures a text label for each route.
-
Arrow configures the arrow styling to display along the route, in order of data.
None
Forward
Reverse
-
Display tooltip lets you toggle tooltips for the layer.
Note
For more information, see Extensions for OpenLayers - Flow Line Style
Photos layer (preview)
The Photos layer renders a photo at each data point.
Note
The Photos layer is currently in public preview. Grafana Labs offers limited support, and breaking changes might occur prior to the feature being made generally available.
Options
-
Image Source Field lets you select a string field containing image data as a Base64 encoded image binary (
data:image/png;base64,...). -
Kind sets the frame style around the images. Choose from:
Square
Circle
Anchored
Folio
-
Crop toggles whether the images are cropped to fit.
-
Shadow toggles a box shadow behind the images.
-
Border sets the border size around images.
-
Border color sets the border color around images.
-
Radius sets the overall size of images in pixels.
-
Display tooltip lets you toggle tooltips for the layer.
Note
For more information, see Extensions for OpenLayers - Image Photo Style
Network layer (preview)
The Network layer renders a network graph. This layers supports the same data format supported by the node graph visualization, with the addition of geospatial data included in the nodes data. The geospatial data is used to locate and render the nodes on the map.
Note
The Network layer is currently in public preview. Grafana Labs offers limited support, and breaking changes might occur prior to the feature being made generally available.

Note
The Network layer is currently in public preview. Grafana Labs offers limited support, and breaking changes might occur prior to the feature being made generally available.
Options
-
Arrow sets the arrow direction to display for each edge, with forward meaning source to target. Choose from:
None
Forward
Reverse
Both
-
Show legend lets you toggle the legend for the layer. The legend only supports node data.
-
Display tooltip lets you toggle tooltips for the layer.
Node styles
-
Size configures the size of the nodes. The default is Fixed size, which makes all node sizes the same regardless of the data; however, there is also an option to size the nodes based on data corresponding to a selected field. Min and Max node sizes have to be set such that the nodes can scale within this range.
-
Color configures the color of the nodes. The default is Fixed color, which sets all nodes to a specific color. There is also an option to have conditional colors depending on the selected field data point values and the color scheme set in the Standard options section.
-
Symbol lets you choose the symbol, icon, or graphic to aid in providing additional visual context to your data. Choose from assets that are included with Grafana, such as simple symbols or the Unicon library. You can also specify a URL containing an image asset. The image must be a scalable vector graphic (SVG).
-
Fill opacity configures the transparency of each node.
-
Rotation angle configures the rotation angle of each node. The default is Fixed value, which makes all nodes rotate to the same angle regardless of the data; however, there is also an option to set the rotation of the nodes based on data corresponding to a selected field.
-
Text label configures a text label for each node.
Edge styles
-
Size configures the line width of the edges. The default is Fixed size, which makes all edge line widths the same regardless of the data; however, there is also an option to size the edges based on data corresponding to a selected field. Min and Max edge sizes have to be set such that the edges can scale within this range.
-
Color configures the color of the edges. The default is Fixed color, which sets all edges to a specific color. There is also an option to have conditional colors depending on the selected field data point values and the color scheme set in the Standard options section.
-
Fill opacity configures the transparency of each edge.
-
Text label configures a text label for each edge.
CARTO layer
CARTO layers are not supported in Amazon Managed Grafana.
XYZ tile layer
XYZ tile layers are not supported in Amazon Managed Grafana.
Open Street Map layer
Open Street Map layers (other than the default basedmap) are not supported in Amazon Managed Grafana.
ArcGIS layer
ArcGIS layers are not supported in Amazon Managed Grafana.
Map Controls
The map controls section contains various options for map information and tool overlays.
Zoom
Options for zoom controls.
Show zoom control
Displays zoom controls in the upper left corner.
Mouse wheel zoom
Turns on or off using the mouse wheel for zooming in or out.
Show attribution
Displays attribution for basemap layers on the map.
Show scale
Displays scale information in the bottom left corner.
Note
Displays units in [m]/[km].
Show measure tools
Displays measure tools in the upper right corner. Measurements appear only when this control is open.
-
Click to start measuring
-
Continue clicking to continue measurement
-
Double-click to end measurement
Note
When you change measurement type or units, the previous measurement is removed from the map.
If the control is closed and then re-opened, the most recent measurement is displayed.
A measurement can be modified by clicking and dragging on it.
Length
Get the spherical length of a geometry. This length is the sum of the great circle distances between coordinates. For multi-part geometries, the length is the sum of the length of each part. Geometries are assumed to be in ‘EPSG:3857’.
You can choose the following units for length measurements:
-
Metric (m/km)
-
Feet (ft)
-
Miles (mi)
-
Nautical miles (nmi)
Area
Get the spherical area of a geometry. This area is calculated assuming that polygon edges are segments of great circles on a sphere. Geometries are assumed to be in ‘EPSG:3857’.
You can choose the following units for area measurements:
-
Square Meters (m²)
-
Square Kilometers (km²)
-
Square Feet (ft²)
-
Square Miles (mi²)
-
Acres (acre)
-
Hectare (ha)
Show debug
Displays debug information in the upper right corner of the map. This can be useful for debugging or validating a data source.
-
Zoom displays the current zoom level of the map.
-
Center displays the current longitude, and latitude of the map center.
Tooltip
-
None displays tooltips only when a data point is clicked.
-
Details displays tooltips when a pointer hovers over a data point.
