Le traduzioni sono generate tramite traduzione automatica. In caso di conflitto tra il contenuto di una traduzione e la versione originale in Inglese, quest'ultima prevarrà.
Tracciamento di applicazioni basate sugli eventi
AWS X-Ray supporta il tracciamento di applicazioni basate su eventi utilizzando Amazon SQS e. AWS Lambda Usa la CloudWatch console per visualizzare una vista connessa di ogni richiesta mentre viene messa in coda con Amazon SQS ed elaborata da una o più funzioni Lambda. Le tracce dei produttori di messaggi upstream vengono automaticamente collegate alle tracce dei nodi consumer Lambda a valle, creando una end-to-end visualizzazione dell'applicazione.
Nota
Ogni segmento di traccia può essere collegato a un massimo di 20 tracce, mentre una traccia può includere un massimo di 100 link. In alcuni scenari, il collegamento di tracce aggiuntive può comportare il superamento della dimensione massima del documento di traccia, causando una traccia potenzialmente incompleta. Ciò può accadere, ad esempio, quando una funzione Lambda con tracciamento abilitato invia molti messaggi SQS a una coda in un'unica chiamata. Se si verifica questo problema, è disponibile una soluzione di mitigazione che utilizza gli X-Ray SDKs. Per ulteriori informazioni, consulta X-Ray SDK per Java
Visualizza le tracce collegate nella mappa di tracciamento
Utilizza la pagina Trace Map all'interno della CloudWatchconsole
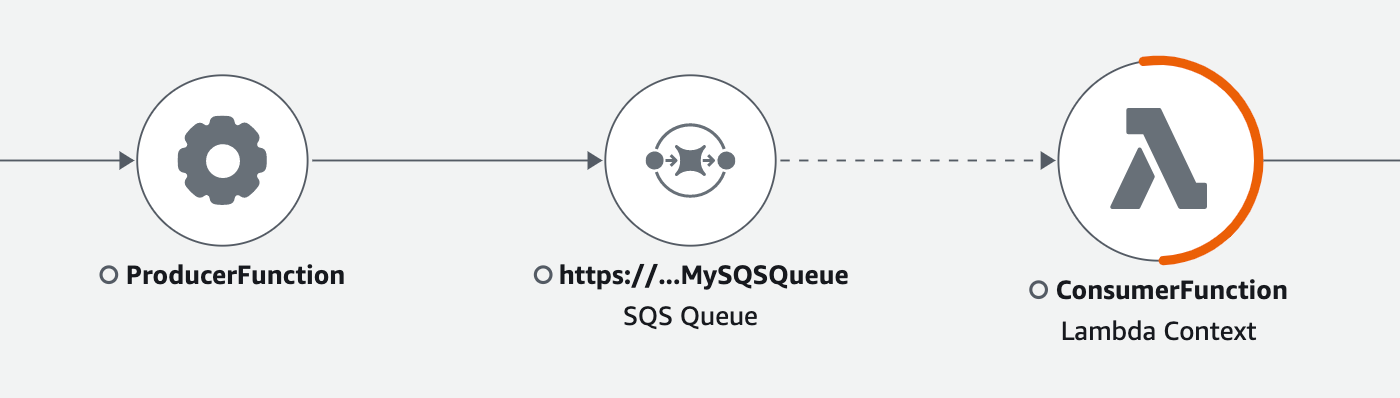
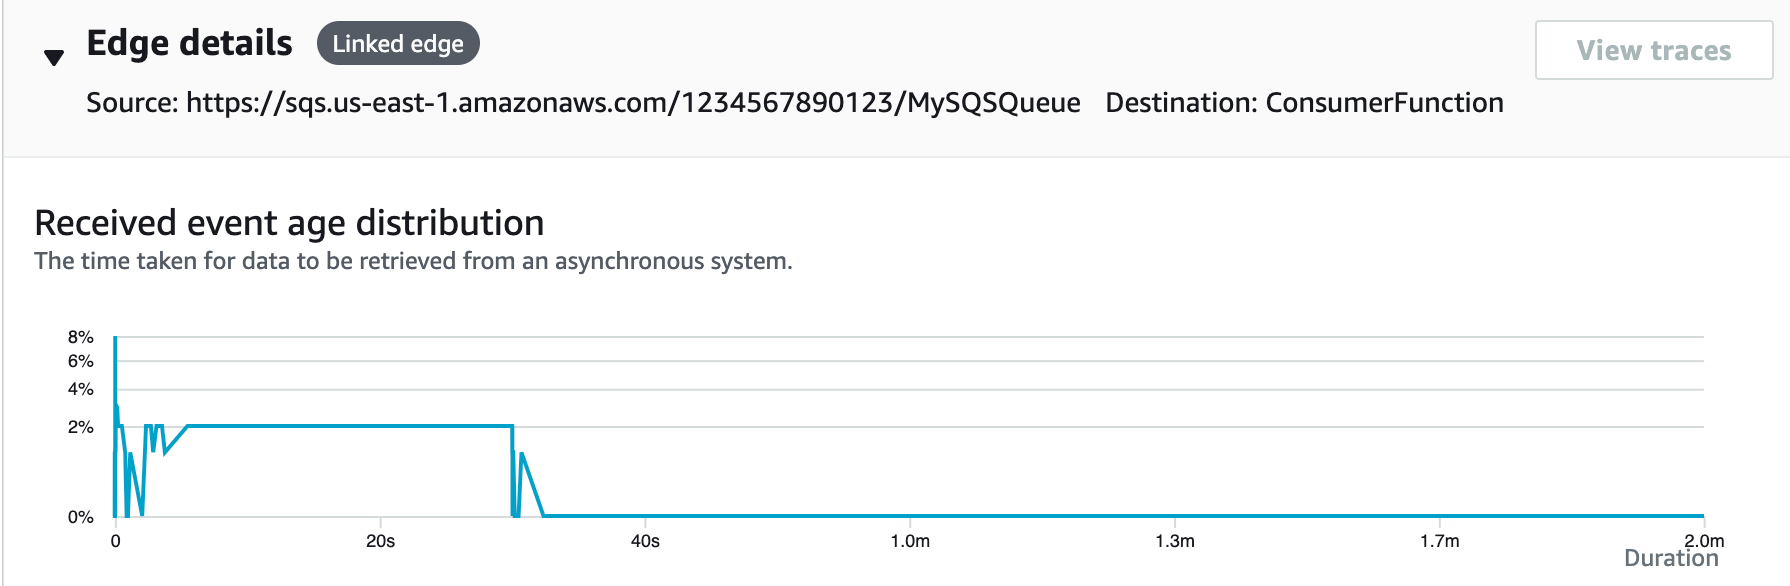
Seleziona un bordo tratteggiato per visualizzare un istogramma dell'età degli eventi ricevuti, che mappa la diffusione dell'età dell'evento quando viene ricevuto dai consumatori. L'età viene calcolata ogni volta che viene ricevuto un evento.
Visualizza i dettagli della traccia collegata
Visualizza i dettagli di tracciamento inviati da un produttore di messaggi, da una coda Amazon SQS o da un consumatore Lambda:
-
Usa la Trace Map per selezionare un produttore di messaggi, un nodo consumer Amazon SQS o Lambda.
-
Scegli Visualizza tracce dal riquadro dei dettagli del nodo per visualizzare un elenco di tracce. Puoi anche accedere direttamente alla pagina Traces all'interno della CloudWatch console.
-
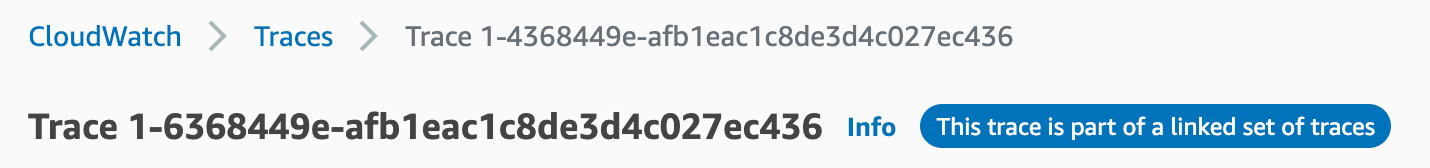
Scegli una traccia specifica dall'elenco per aprire la pagina dei dettagli della traccia. La pagina dei dettagli della traccia visualizza un messaggio quando la traccia selezionata fa parte di un set di tracce collegato.
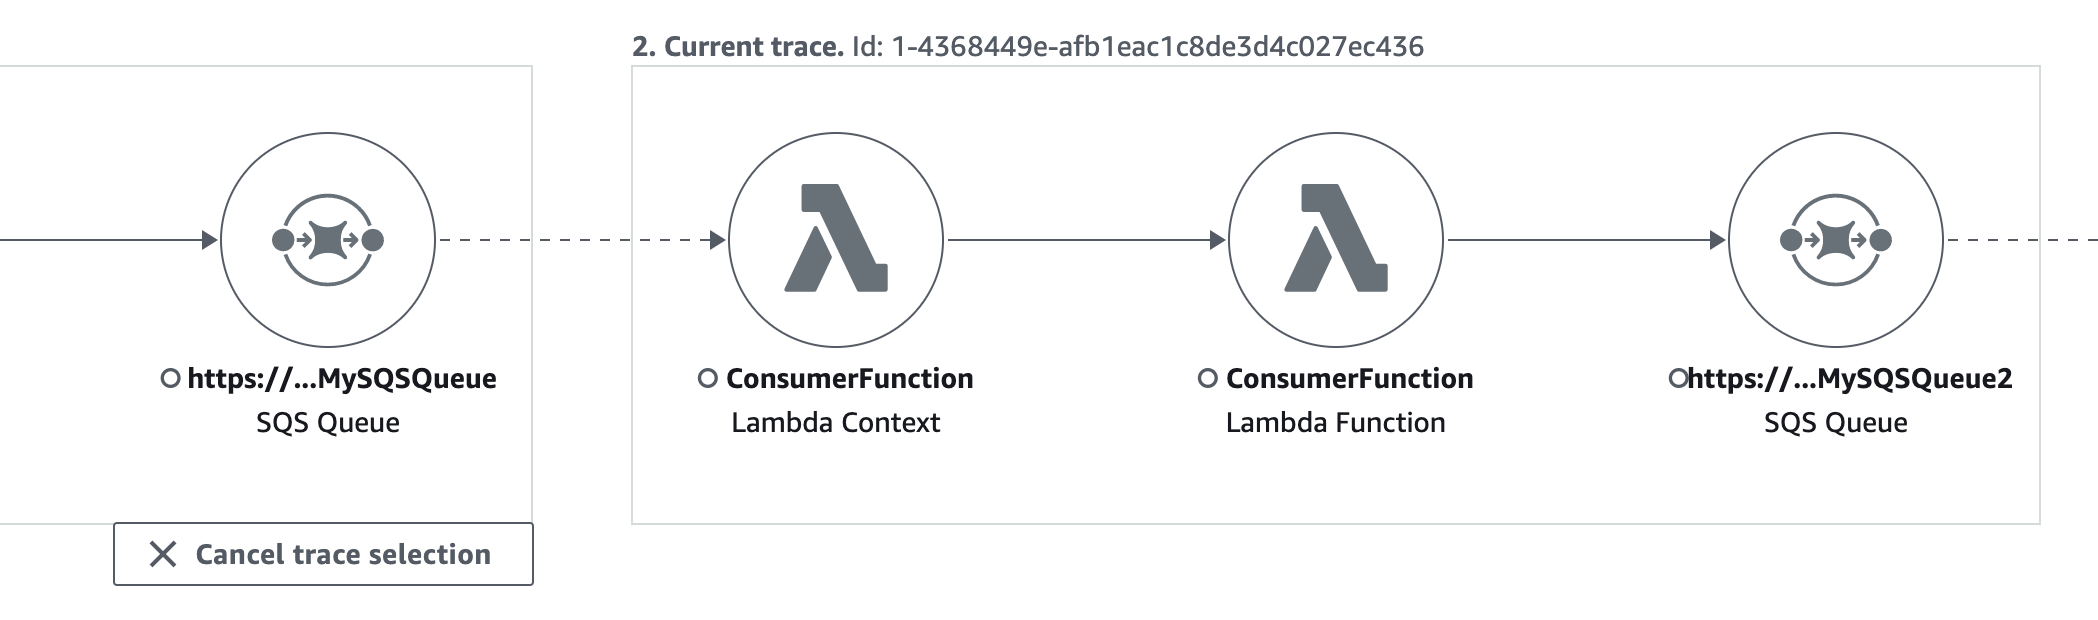
La mappa dei dettagli della traccia mostra la traccia corrente, insieme alle tracce collegate a monte e a valle, ognuna delle quali è contenuta in un riquadro che indica i limiti di ciascuna traccia. Se la traccia attualmente selezionata è collegata a più tracce a monte o a valle, i nodi all'interno delle tracce collegate a monte o a valle vengono impilati e viene visualizzato il pulsante Seleziona traccia.
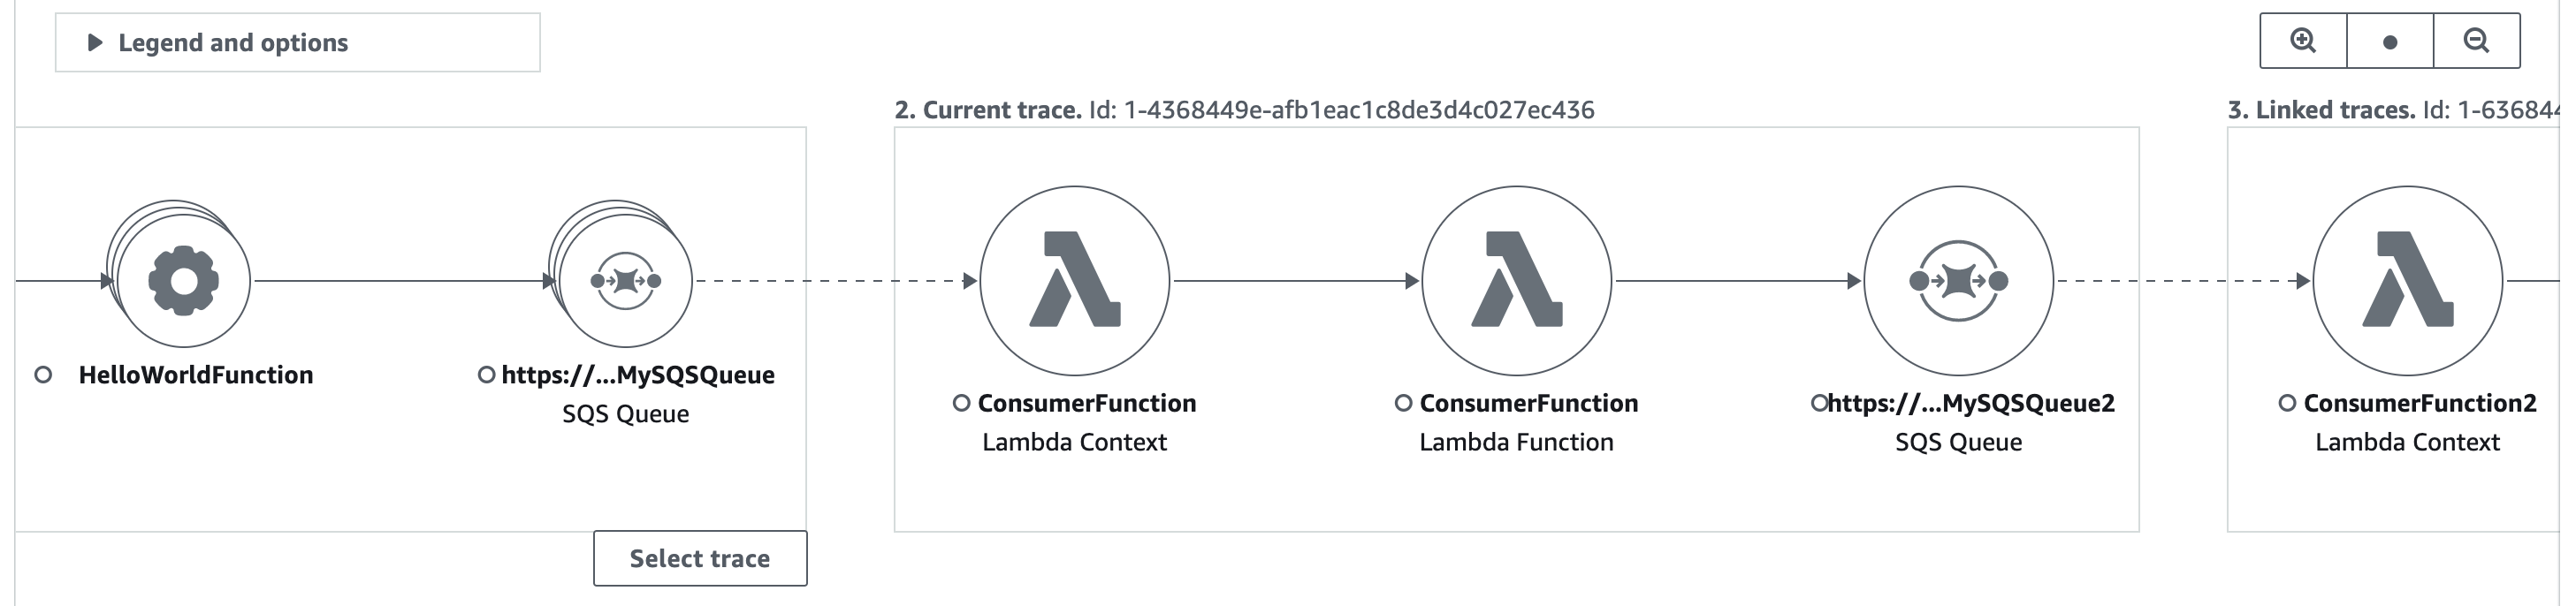
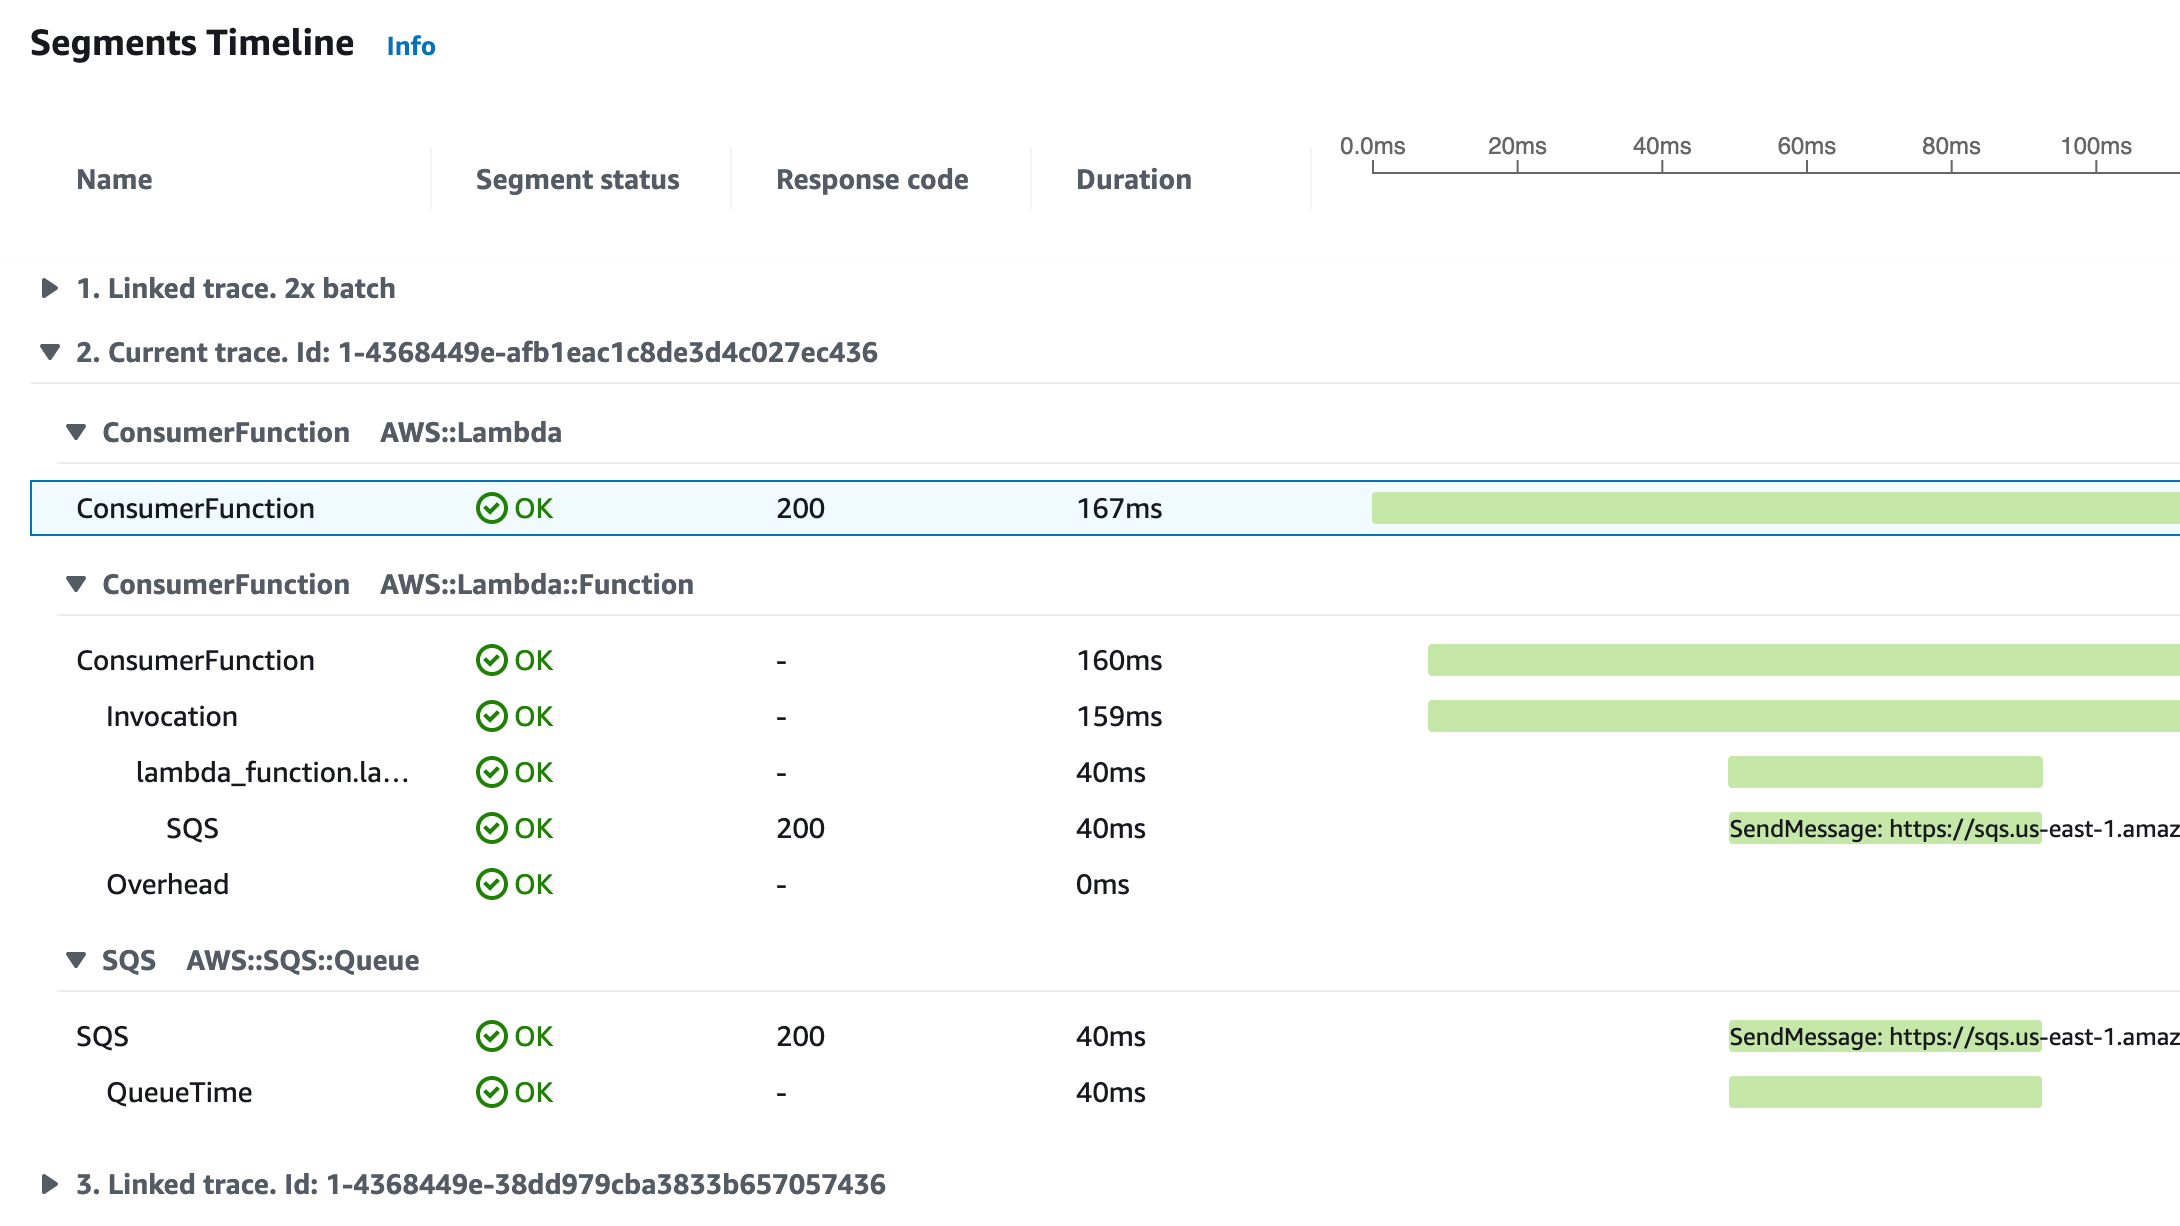
Sotto la mappa dei dettagli della traccia, viene visualizzata una sequenza temporale dei segmenti di traccia, incluse le tracce collegate a monte e a valle. Se sono presenti più tracce collegate a monte o a valle, i relativi dettagli del segmento non possono essere visualizzati. Per visualizzare i dettagli del segmento per una singola traccia all'interno di un insieme di tracce collegate, selezionate una singola traccia come descritto di seguito.
Seleziona una singola traccia all'interno di un insieme di tracce collegate
Filtra un set di tracce collegato a una singola traccia per visualizzare i dettagli del segmento nella timeline.
-
Scegli Seleziona traccia sotto le tracce collegate sulla mappa dei dettagli della traccia. Viene visualizzato un elenco di tracce.
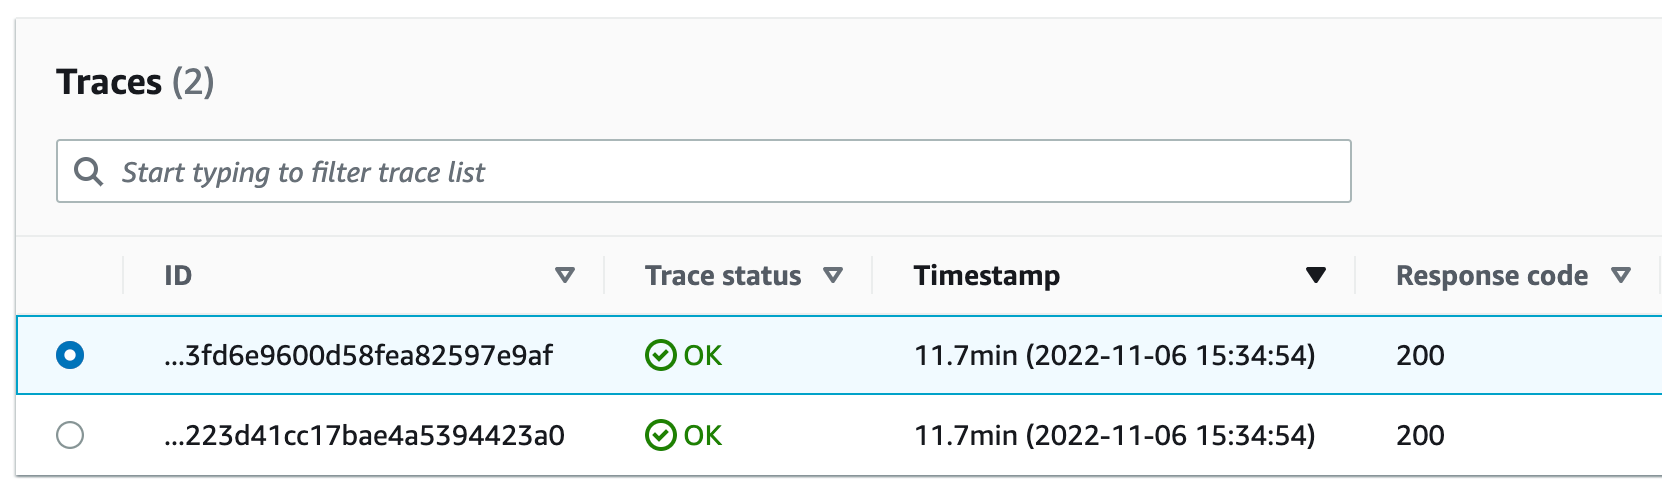
-
Seleziona il pulsante di opzione accanto a una traccia per visualizzarla all'interno della mappa dei dettagli della traccia.
-
Scegliete Annulla la selezione della traccia per visualizzare l'intero set di tracce collegate.