慎重な検討の結果、Amazon Kinesis Data Analytics for SQL アプリケーションのサポートは終了することになりました。サポート終了は次の 2 段階で行われます。
1. 2025 年 10 月 15 日以降、新しい Kinesis Data Analytics for SQL アプリケーションを作成することはできなくなります。
2. 2026 年 1 月 27 日以降、アプリケーションは削除されます。Amazon Kinesis Data Analytics for SQL アプリケーションを起動することも操作することもできなくなります。これ以降、Amazon Kinesis Data Analytics for SQL のサポートは終了します。詳細については、「Amazon Kinesis Data Analytics for SQL アプリケーションのサポート終了」を参照してください。
翻訳は機械翻訳により提供されています。提供された翻訳内容と英語版の間で齟齬、不一致または矛盾がある場合、英語版が優先します。
ステップ 4: アプリケーション出力を検証する
ホットスポット例のこのセクションで、ホットスポット情報を Scalable Vector Graphics (SVG) コントロールに表示するウェブアプリケーションを設定します。
-
次の内容で、
index.htmlという名前のファイルを作成します。<!doctype html> <html lang=en> <head> <meta charset=utf-8> <title>hotspots viewer</title> <style> #visualization { display: block; margin: auto; } .point { opacity: 0.2; } .hot { fill: red; } .cold { fill: blue; } .hotspot { stroke: black; stroke-opacity: 0.8; stroke-width: 1; fill: none; } </style> <script src="https://sdk.amazonaws.com/js/aws-sdk-2.202.0.min.js"></script> <script src="https://d3js.org/d3.v4.min.js"></script> </head> <body> <svg id="visualization" width="600" height="600"></svg> <script src="hotspots_viewer.js"></script> </body> </html> -
次の内容の
hotspots_viewer.jsというファイルを、同じディレクトリに作成します。認証情報、および出力ストリーム名を指定された変数に設定します。// Visualize example output from the Kinesis Analytics hotspot detection algorithm. // This script assumes that the output stream has a single shard. // Modify this section to reflect your AWS configuration var awsRegion = "", // The where your Kinesis Analytics application is configured. accessKeyId = "", // Your Access Key ID secretAccessKey = "", // Your Secret Access Key outputStream = ""; // The name of the Kinesis Stream where the output from the HOTSPOTS function is being written // The variables in this section should reflect way input data was generated and the parameters that the HOTSPOTS // function was called with. var windowSize = 1000, // The window size used for hotspot detection minimumDensity = 40, // A filter applied to returned hotspots before visualization xRange = [0, 10], // The range of values to display on the x-axis yRange = [0, 10]; // The range of values to display on the y-axis //////////////////////////////////////////////////////////////////////////////////////////////////////////////////////// // D3 setup //////////////////////////////////////////////////////////////////////////////////////////////////////////////////////// var svg = d3.select("svg"), margin = {"top": 20, "right": 20, "bottom": 20, "left": 20}, graphWidth = +svg.attr("width") - margin.left - margin.right, graphHeight = +svg.attr("height") - margin.top - margin.bottom; // Return the linear function that maps the segment [a, b] to the segment [c, d]. function linearScale(a, b, c, d) { var m = (d - c) / (b - a); return function(x) { return c + m * (x - a); }; } // helper functions to extract the x-value from a stream record and scale it for output var xValue = function(r) { return r.x; }, xScale = linearScale(xRange[0], xRange[1], 0, graphWidth), xMap = function(r) { return xScale(xValue(r)); }; // helper functions to extract the y-value from a stream record and scale it for output var yValue = function(r) { return r.y; }, yScale = linearScale(yRange[0], yRange[1], 0, graphHeight), yMap = function(r) { return yScale(yValue(r)); }; // a helper function that assigns a CSS class to a point based on whether it was generated as part of a hotspot var classMap = function(r) { return r.is_hot == "Y" ? "point hot" : "point cold"; }; var g = svg.append("g") .attr("transform", "translate(" + margin.left + "," + margin.top + ")"); function update(records, hotspots) { var points = g.selectAll("circle") .data(records, function(r) { return r.dataIndex; }); points.enter().append("circle") .attr("class", classMap) .attr("r", 3) .attr("cx", xMap) .attr("cy", yMap); points.exit().remove(); if (hotspots) { var boxes = g.selectAll("rect").data(hotspots); boxes.enter().append("rect") .merge(boxes) .attr("class", "hotspot") .attr("x", function(h) { return xScale(h.minValues[0]); }) .attr("y", function(h) { return yScale(h.minValues[1]); }) .attr("width", function(h) { return xScale(h.maxValues[0]) - xScale(h.minValues[0]); }) .attr("height", function(h) { return yScale(h.maxValues[1]) - yScale(h.minValues[1]); }); boxes.exit().remove(); } } //////////////////////////////////////////////////////////////////////////////////////////////////////////////////////// // Use the AWS SDK to pull output records from Kinesis and update the visualization //////////////////////////////////////////////////////////////////////////////////////////////////////////////////////// var kinesis = new AWS.Kinesis({ "region": awsRegion, "accessKeyId": accessKeyId, "secretAccessKey": secretAccessKey }); var textDecoder = new TextDecoder("utf-8"); // Decode an output record into an object and assign it an index value function decodeRecord(record, recordIndex) { var record = JSON.parse(textDecoder.decode(record.Data)); var hotspots_result = JSON.parse(record.HOTSPOTS_RESULT); record.hotspots = hotspots_result.hotspots .filter(function(hotspot) { return hotspot.density >= minimumDensity}); record.index = recordIndex return record; } // Fetch a new records from the shard iterator, append them to records, and update the visualization function getRecordsAndUpdateVisualization(shardIterator, records, lastRecordIndex) { kinesis.getRecords({ "ShardIterator": shardIterator }, function(err, data) { if (err) { console.log(err, err.stack); return; } var newRecords = data.Records.map(function(raw) { return decodeRecord(raw, ++lastRecordIndex); }); newRecords.forEach(function(record) { records.push(record); }); var hotspots = null; if (newRecords.length > 0) { hotspots = newRecords[newRecords.length - 1].hotspots; } while (records.length > windowSize) { records.shift(); } update(records, hotspots); getRecordsAndUpdateVisualization(data.NextShardIterator, records, lastRecordIndex); }); } // Get a shard iterator for the output stream and begin updating the visualization. Note that this script will only // read records from the first shard in the stream. function init() { kinesis.describeStream({ "StreamName": outputStream }, function(err, data) { if (err) { console.log(err, err.stack); return; } var shardId = data.StreamDescription.Shards[0].ShardId; kinesis.getShardIterator({ "StreamName": outputStream, "ShardId": shardId, "ShardIteratorType": "LATEST" }, function(err, data) { if (err) { console.log(err, err.stack); return; } getRecordsAndUpdateVisualization(data.ShardIterator, [], 0); }) }); } // Start the visualization init(); -
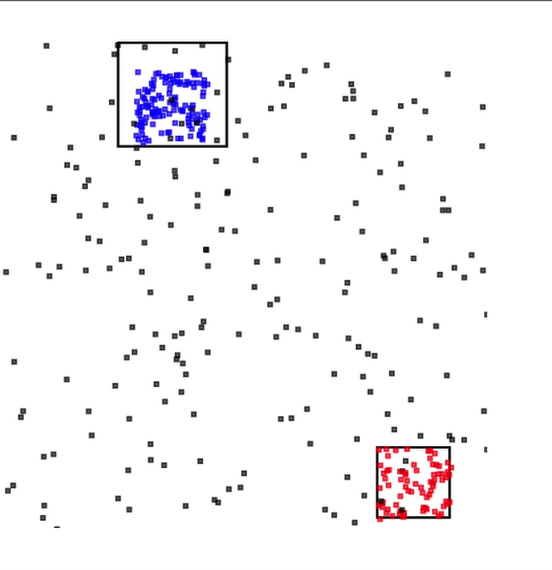
最初のセクションの Python コードを実行し、ウェブブラウザで
index.htmlを開きます。ホットスポット情報がページに次のように表示されます。