Working with anomalies
An anomaly is a data point that the detector doesn't expect based on its understanding of your data. An anomaly isn't necessarily good or bad, it's just unexpected. A detector learns over time to more accurately identify anomalies based on patterns that it finds in your data.
Lookout for Metrics organizes anomalies that affect the same measure during the same interval groups and displays them as a single event. To get details about anomalies, view them in the Amazon Lookout for Metrics console.
To view anomalies
Open the Lookout for Metrics console Detectors
page. -
Choose a detector.
-
Choose Anomalies.
-
Use the options on the page to sort and filter the list of anomalies.
-
Search bar – To filter the list of anomalies by title, enter the name of a measure.
-
Severity threshold – To filter out lower-severity anomalies but maintain the display order, use the severity threshold slider.
-
Sort columns – To sort by title, severity score, or timestamp, choose the name of the relevant column.
-
-
For details, choose an anomaly from the list.
The detector assigns a severity score between 0 and 100. The severity score indicates how far the data point is outside of the expected range based on the data that the detector has analyzed. The higher the severity score, the more unexpected the anomaly is.
Causal relationships
The Causal relationships section identifies the measures in your datasets that are potentially causing anomalies at specific time points, and also identifies other measures that may be impacted by the anomaly.
During anomaly detection periods, Lookout for Metrics identifies measures that are likely causing particular anomalies, determines the direction of influence, and quantifies the level of contribution.
Causal relationships is divided into two sections: Potential causes and Effects. Potential causes are measures that are potentially causing the inspected anomaly. The Effects section shows the inspected anomaly and any measures that may be impacted by the anomaly.
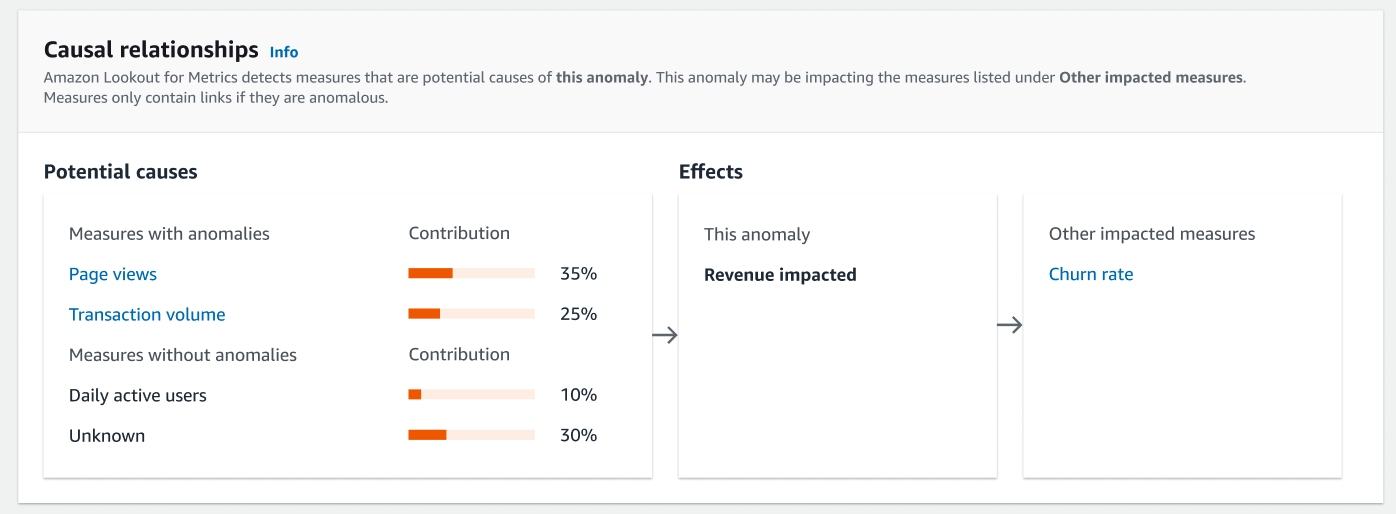
Potential causes
All measures listed under Potential causes are contributing to the anomaly. Measures with anomalies are anomalous measures, and you can use the links to learn more about those anomalies. Measures without anomalies are measures that do not contain anomalies, but still contribute to the anomaly you are inspecting.
You can gauge the impact each measure had in causing the anomaly by comparing the contribution percentages of the listed measures.
The unexplained portion of the anomaly is represented as “Unknown”. This is the contribution of factors that are not captured in the measures.
Effects
The Effects section shows the anomaly you are reviewing and any measures that may be impacted by the anomaly.
The anomaly you are reviewing is listed under This anomaly, and any measures that may be impacted by this anomaly are listed under Other impacted measures. You can use the links to learn more about the anomalies within those measures.
Affected measures
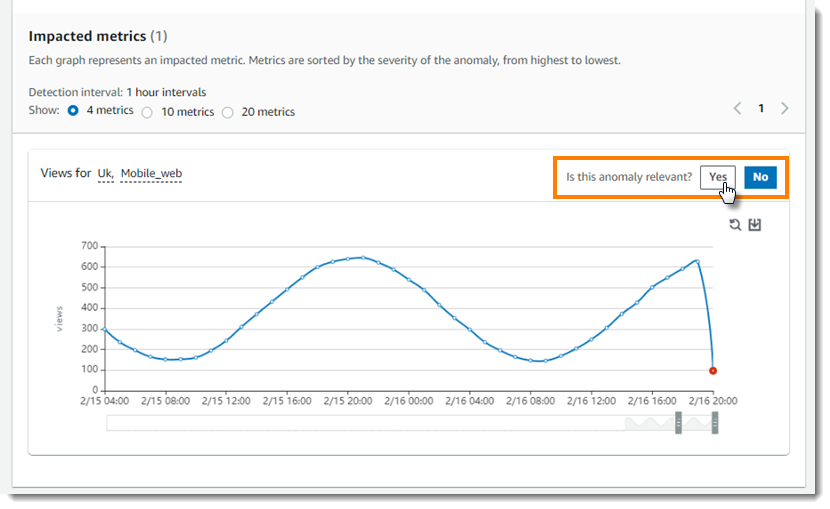
The title of an anomaly indicates the measure that was affected. If your dataset has
dimensions, the values of each dimension are also part of the metric. In the following
example, the number of views recorded was anomalous. The dataset has two
dimensions, marketplace and platform, with values that indicate
where the metric was recorded and the kind of device that was in use. The number of views was
found to be affected only in the UK marketplace (Uk) on mobile platforms
(Mobile_web). The 100% for each dimension value
indicates that the anomaly was only observed for one value within each dimension.

Below the impact summary, there is a graph of the affected metric over time. In this example, the number of mobile views in the UK dropped sharply between 7 PM and 8 PM. This drop was unexpected considering the marketplace, platform, and time of day.
Providing feedback
This drop could indicate an issue in the marketplace and platform, or an external factor that isn't represented in the data. To indicate whether the anomaly is relevant, use the feedback buttons above the graph. When the detector finds similar anomalies later, it will consider the feedback as it determines the severity score.
Contributing metrics
If the detector finds anomalies in multiple metrics for the same measure, it groups them
together into a single event. In the following example, metrics for revenue on
the PC platform are affected on PC in both Italy and France, but to a greater degree in Italy.
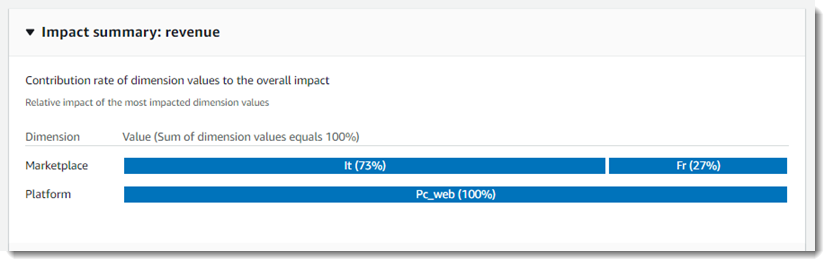
In this case, revenue on PC in Italy is one metric, and revenue on PC in France is a second. If mobile revenue was also affected in both marketplaces, there would be four metrics, and the platform dimension would show the impact of PC vs mobile revenue.
