After careful consideration, we have decided to discontinue Amazon Kinesis Data Analytics for SQL applications in two steps:
1. From October 15, 2025, you will not be able to create new Kinesis Data Analytics for SQL applications.
2. We will delete your applications starting January 27, 2026. You will not be able to start or operate your Amazon Kinesis Data Analytics for SQL applications. Support will no longer be available for Amazon Kinesis Data Analytics for SQL from that time. For more information, see Amazon Kinesis Data Analytics for SQL Applications discontinuation.
Step 4: Verify the Application Output
In this section of the Hotspots example, you set up a web application that displays the hotspot information in a Scalable Vector Graphics (SVG) control.
-
Create a file named
index.htmlwith the following contents:<!doctype html> <html lang=en> <head> <meta charset=utf-8> <title>hotspots viewer</title> <style> #visualization { display: block; margin: auto; } .point { opacity: 0.2; } .hot { fill: red; } .cold { fill: blue; } .hotspot { stroke: black; stroke-opacity: 0.8; stroke-width: 1; fill: none; } </style> <script src="https://sdk.amazonaws.com/js/aws-sdk-2.202.0.min.js"></script> <script src="https://d3js.org/d3.v4.min.js"></script> </head> <body> <svg id="visualization" width="600" height="600"></svg> <script src="hotspots_viewer.js"></script> </body> </html> -
Create a file in the same directory named
hotspots_viewer.jswith the following contents. Provide your , credentials, and output stream name in the variables provided.// Visualize example output from the Kinesis Analytics hotspot detection algorithm. // This script assumes that the output stream has a single shard. // Modify this section to reflect your AWS configuration var awsRegion = "", // The where your Kinesis Analytics application is configured. accessKeyId = "", // Your Access Key ID secretAccessKey = "", // Your Secret Access Key outputStream = ""; // The name of the Kinesis Stream where the output from the HOTSPOTS function is being written // The variables in this section should reflect way input data was generated and the parameters that the HOTSPOTS // function was called with. var windowSize = 1000, // The window size used for hotspot detection minimumDensity = 40, // A filter applied to returned hotspots before visualization xRange = [0, 10], // The range of values to display on the x-axis yRange = [0, 10]; // The range of values to display on the y-axis //////////////////////////////////////////////////////////////////////////////////////////////////////////////////////// // D3 setup //////////////////////////////////////////////////////////////////////////////////////////////////////////////////////// var svg = d3.select("svg"), margin = {"top": 20, "right": 20, "bottom": 20, "left": 20}, graphWidth = +svg.attr("width") - margin.left - margin.right, graphHeight = +svg.attr("height") - margin.top - margin.bottom; // Return the linear function that maps the segment [a, b] to the segment [c, d]. function linearScale(a, b, c, d) { var m = (d - c) / (b - a); return function(x) { return c + m * (x - a); }; } // helper functions to extract the x-value from a stream record and scale it for output var xValue = function(r) { return r.x; }, xScale = linearScale(xRange[0], xRange[1], 0, graphWidth), xMap = function(r) { return xScale(xValue(r)); }; // helper functions to extract the y-value from a stream record and scale it for output var yValue = function(r) { return r.y; }, yScale = linearScale(yRange[0], yRange[1], 0, graphHeight), yMap = function(r) { return yScale(yValue(r)); }; // a helper function that assigns a CSS class to a point based on whether it was generated as part of a hotspot var classMap = function(r) { return r.is_hot == "Y" ? "point hot" : "point cold"; }; var g = svg.append("g") .attr("transform", "translate(" + margin.left + "," + margin.top + ")"); function update(records, hotspots) { var points = g.selectAll("circle") .data(records, function(r) { return r.dataIndex; }); points.enter().append("circle") .attr("class", classMap) .attr("r", 3) .attr("cx", xMap) .attr("cy", yMap); points.exit().remove(); if (hotspots) { var boxes = g.selectAll("rect").data(hotspots); boxes.enter().append("rect") .merge(boxes) .attr("class", "hotspot") .attr("x", function(h) { return xScale(h.minValues[0]); }) .attr("y", function(h) { return yScale(h.minValues[1]); }) .attr("width", function(h) { return xScale(h.maxValues[0]) - xScale(h.minValues[0]); }) .attr("height", function(h) { return yScale(h.maxValues[1]) - yScale(h.minValues[1]); }); boxes.exit().remove(); } } //////////////////////////////////////////////////////////////////////////////////////////////////////////////////////// // Use the AWS SDK to pull output records from Kinesis and update the visualization //////////////////////////////////////////////////////////////////////////////////////////////////////////////////////// var kinesis = new AWS.Kinesis({ "region": awsRegion, "accessKeyId": accessKeyId, "secretAccessKey": secretAccessKey }); var textDecoder = new TextDecoder("utf-8"); // Decode an output record into an object and assign it an index value function decodeRecord(record, recordIndex) { var record = JSON.parse(textDecoder.decode(record.Data)); var hotspots_result = JSON.parse(record.HOTSPOTS_RESULT); record.hotspots = hotspots_result.hotspots .filter(function(hotspot) { return hotspot.density >= minimumDensity}); record.index = recordIndex return record; } // Fetch a new records from the shard iterator, append them to records, and update the visualization function getRecordsAndUpdateVisualization(shardIterator, records, lastRecordIndex) { kinesis.getRecords({ "ShardIterator": shardIterator }, function(err, data) { if (err) { console.log(err, err.stack); return; } var newRecords = data.Records.map(function(raw) { return decodeRecord(raw, ++lastRecordIndex); }); newRecords.forEach(function(record) { records.push(record); }); var hotspots = null; if (newRecords.length > 0) { hotspots = newRecords[newRecords.length - 1].hotspots; } while (records.length > windowSize) { records.shift(); } update(records, hotspots); getRecordsAndUpdateVisualization(data.NextShardIterator, records, lastRecordIndex); }); } // Get a shard iterator for the output stream and begin updating the visualization. Note that this script will only // read records from the first shard in the stream. function init() { kinesis.describeStream({ "StreamName": outputStream }, function(err, data) { if (err) { console.log(err, err.stack); return; } var shardId = data.StreamDescription.Shards[0].ShardId; kinesis.getShardIterator({ "StreamName": outputStream, "ShardId": shardId, "ShardIteratorType": "LATEST" }, function(err, data) { if (err) { console.log(err, err.stack); return; } getRecordsAndUpdateVisualization(data.ShardIterator, [], 0); }) }); } // Start the visualization init(); -
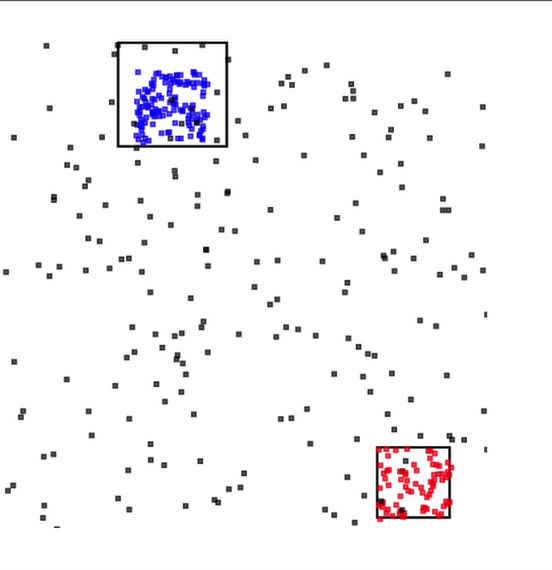
With the Python code from the first section running, open
index.htmlin a web browser. The hotspot information appears on the page, as shown following.