Troubleshooting walkthrough: isolating and resolving issues
In the Coffee Lookup example
Topics
Reproducing the problem
The first step is to reproduce the problem. Invoking the API using curl or Postman shows that the API is operating but does not highlight any errors. By running a load test against the backend API with Artillery
In a test with 1500 requests over 5 minutes, 25% of the requests are failing with 502 errors and the overall performance is highly variable. While the median response time is 522 ms, which is worse than expected, the p95 response times are over 5.7 seconds. The Artillery report breaks down these findings further:

To learn more about load testing serverless APIs, see https://aws.amazon.com/blogs/compute/load-testing-a-web-applications-serverless-backend
Isolating the cause of errors
While the Artillery load test reports round-trip timings for API calls, it’s important to know the portion of latency caused by the backend application. I use X-Ray to investigate latency between the various AWS services used in the application. This helps to exclude networking delays or issues that are local to the client device. After a load test, I can check X-Ray or ServiceLens to verify the roundtrip performance once the requests are received by the API.

The service map shows service latency and failures in about 25% of the requests. X-Ray allows you to drill into requests by status code to further identify the causes of 502 errors. In this case, the error traces show that DynamoDB performance is normal but the Lambda function is raising an error after 5 seconds:

Investigating further in the CloudWatch Logs for the failing function, the error messages indicate that the function has timed out. The function is configured with a maximum duration of 5 seconds. While I can increase this timeout value to eliminate the error, the underlying cause of the error is still unknown. When I increase the timeout or the memory allocated to the Lambda function and run the load test again, this results in a higher percentage of 502 errors.
When Lambda functions generate more errors as resources are increased, this can often indicate a downstream issue. For this application, the next downstream service is DynamoDB. Looking at the metrics for resource consumption on the DynamoDB table, this indicates the source of the problem:
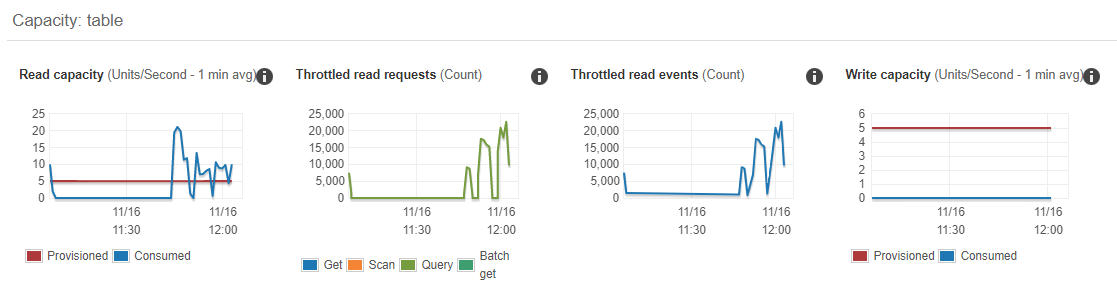
The read capacity of the table is set to 5 RCUs in the AWS SAM template for the application. The load test is driving RCU usage to above 20 and the DynamoDB table is throttling read requests. This is not handled by the custom code in the Lambda function, resulting in a time-out error. By setting the DynamoDB table’s RCU value to 25 and re-running the test, I can compare the results in X-Ray:

All of the requests are now returning without errors but the performance of the Lambda function is still below expectations.
Isolating the performance issue

In testing the function from an AWS Cloud9 instance and a local development machine, the average performance is faster, averaging 250 ms. The comparatively slow performance when running in Lambda is likely caused by the configuration instead of the code.
First, I check if the Lambda function is running out of memory, since this is a major cause of slow-running functions. Using CloudWatch Insights, I can analyze the amount of memory used by the function during the load test. I use the Percentile report of Lambda memory usage query from the previous section.
The results indicate that the function is using a maximum of 154.5 MB and 5% of all invocations use above 151.6 MB. The function is allocated 256 MB so it is not close to the memory maximum. However, memory settings in Lambda also determine the amount of virtual CPU available, so act as a power control. The function is computationally heavy so may benefit from more memory since this provides more computational power.
I increase the function’s memory to 1024 MB and re-run the load test. The load test results show an improvement, with a median response time of 395 ms.

The X-Ray service map now also shows faster performance, reducing the average Lambda invocation duration from 739 ms to 284 ms, an improvement of more than 61%.

I can rerun the same test with different Lambda memory settings to determine which configuration provides the fastest performance. While I can do this manually, I can also automate this process to find the ideal balance between duration and cost, as described in chapter 6.
Measuring and improving the performance of outliers
In the latest test, although the average performance is considerably better, the p95 duration is 517 ms and the p99 duration is 747 ms. This means that 5% of all invocations are taking longer than 517 ms and 1% exceed 747 ms. The X-Ray service map shows a response distribution graph for the Lambda function:

Often, the greatest impact contributor to latency in these performance outliers is the effect of cold starts. By running the Percentage of cold starts in total invocations query in CloudWatch Insights, I can find how many cold starts occurred during the load test, and their average duration.

In this case, almost 2% of invocations were cold starts with an average total duration of 1618 ms, which explains the outlier performance. There are many additional optimizations that can be made to the Lambda function to improve the cold start latency, and these are covered in detail in Performance Optimization.
