Troubleshoot configuration issues in Lambda
Your function configuration settings can have an impact on the overall performance and behavior of your Lambda function. These may not cause actual function errors, but can cause unexpected timeouts and results.
The following topics provide troubleshooting advice for common issues that you might encounter related to Lambda function configuration settings.
Topics
Memory configurations
You can configure a Lambda function to use between 128 MB and 10,240 MB of memory. By default, any function created in the console is assigned the smallest amount of memory. Many Lambda functions are performant at this lowest setting. However, if you are importing large code libraries or completing memory intensive tasks, 128 MB is not sufficient.
If your functions are running much slower than expected, the first step is to increase the memory setting. For memory-bound functions, this will resolve the bottleneck and may improve the performance of your function.
CPU-bound configurations
For compute-intensive operations, if your function experiences slower-than-expected performance, this may be due to your function being CPU-bound. In this case, the computational capacity of the function cannot keep pace with the work.
While Lambda doesn't allow you to modify CPU configuration directly, CPU is indirectly controlled via the memory settings. The Lambda service proportionally allocates more virtual CPU as you allocate more memory. At 1.8 GB memory, a Lambda function has an entire vCPU allocated, and above this level it has access to more than one vCPU core. At 10,240MB, it has 6 vCPUs available. In other words, you can improve performance by increasing the memory allocation, even if the function doesn’t use all of the memory.
Timeouts
Timeouts for Lambda functions can be set between 1 and 900 seconds (15 minutes). By default, the Lambda console sets this to 3 seconds. The timeout value is a safety valve that ensures functions do not run indefinitely. After the timeout value is reached, Lambda stops the function invocation.
If a timeout value is set close to the average duration of a function, this increases the risk that the function will time out unexpectedly. The duration of a function can vary based on the amount of data transfer and processing, and the latency of any services the function interacts with. Common causes of timeout include:
-
When downloading data from S3 buckets or other data stores, the download is larger or takes longer than average.
-
A function makes a request to another service, which takes longer to respond.
-
The parameters provided to a function require more computational complexity in the function, which causes the invocation to take longer.
When testing your application, ensure that your tests accurately reflect the size and quantity of data, and realistic parameter values. Importantly, use datasets at the upper bounds of what is reasonably expected for your workload.
Additionally, implement upper-bound limits in your workload wherever practical. In this example, the application could use a maximum size limit for each file type. You can then test the performance of your application for a range of expected file sizes, up to and including the maximum limits.
Memory leakage between invocations
Global variables and objects stored in the INIT phase of a Lambda invocation retain their state between warm invocations. They are completely reset only when the execution environment is run for the first time (also known as a “cold start”). Any variables stored in the handler are destroyed when the handler exits. It’s best practice to use the INIT phase to set up database connections, load libraries, create caches, and load immutable assets.
When you use third-party libraries across multiple invocations in the same execution environment, check their documentation for usage in a serverless compute environment. Some database connection and logging libraries may save intermediate invocation results and other data. This causes the memory usage of these libraries to grow with subsequent warm invocations. If this is the case, you may find the Lambda function runs out of memory, even if your custom code is disposing of variables correctly.
This issue affects invocations occurring in warm execution environments. For example, the following code creates a memory leak between invocations. The Lambda function consumes additional memory with each invocation by increasing the size of a global array:
let a = []

exports.handler = async (event) => {
    a.push(Array(100000).fill(1))
}
Configured with 128 MB of memory, after invoking this function 1000 times, the Monitoring tab of the Lambda function shows the typical changes in invocations, duration, and error counts when a memory leak occurs:

-
Invocations – A steady transaction rate is interrupted periodically as the invocations take longer to complete. During the steady state, the memory leak is not consuming all of the function’s allocated memory. As performance degrades, the operating system is paging local storage to accommodate the growing memory required by the function, which results in fewer transactions being completed.
-
Duration – Before the function runs out of memory, it finishes invocations at a steady double-digit millisecond rate. As paging occurs, the duration takes an order of magnitude longer.
-
Error count – As the memory leak exceeds allocated memory, eventually the function errors due to the computation exceeding the timeout, or the execution environment stops the function.
After the error, Lambda restarts the execution environment, which explains why all three graphs show a return to the original state. Expanding the CloudWatch metrics for duration provides more detail for the minimum, maximum and average duration statistics:

To find the errors generated across the 1000 invocations, you can use the CloudWatch Insights query language. The following query excludes informational logs to report only the errors:
fields @timestamp, @message
| sort @timestamp desc
| filter @message not like 'EXTENSION'
| filter @message not like 'Lambda Insights'
| filter @message not like 'INFO'
| filter @message not like 'REPORT'
| filter @message not like 'END'
| filter @message not like 'START'
When run against the log group for this function, this shows that timeouts were responsible for the periodic errors:

Asynchronous results returned to a later invocation
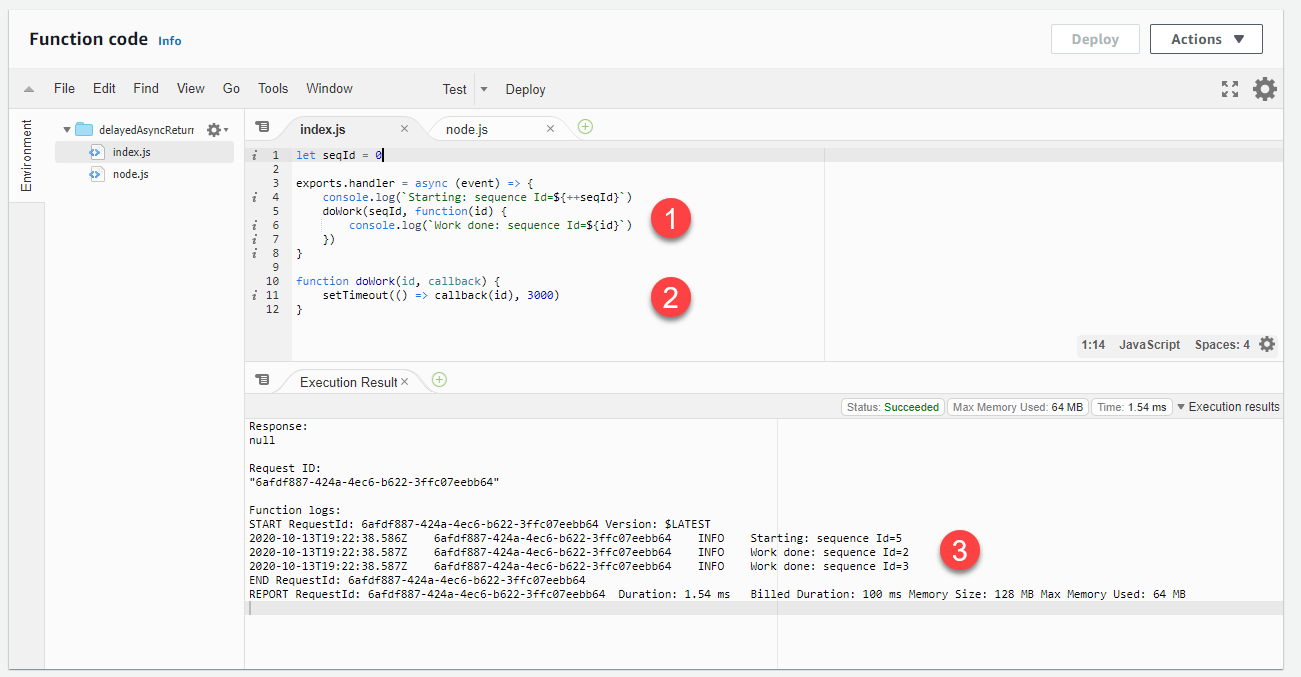
For function code that uses asynchronous patterns, it’s possible for the callback results from one invocation to be returned in a future invocation. This example uses Node.js, but the same logic can apply to other runtimes using asynchronous patterns. The function uses the traditional callback syntax in JavaScript. It calls an asynchronous function with an incremental counter that tracks the number of invocations:
let seqId = 0

exports.handler = async (event, context) => {
    console.log(`Starting: sequence Id=${++seqId}`)
    doWork(seqId, function(id) {
        console.log(`Work done: sequence Id=${id}`)
    })
}

function doWork(id, callback) {
    setTimeout(() => callback(id), 3000)
}
When invoked several times in succession, the results of the callbacks occur in subsequent invocations:
-
The code calls the
doWorkfunction, providing a callback function as the last parameter. -
The
doWorkfunction takes some period of time to complete before invoking the callback. -
The function’s logging indicates that the invocation is ending before the
doWorkfunction finishes execution. Additionally, after starting an iteration, callbacks from previous iterations are being processed, as shown in the logs.
In JavaScript, asynchronous callbacks are handled with an
event loop
This creates the potential for private data from a previous invocation to appear in a subsequent invocation. There are
two ways to prevent or detect this behavior. First, JavaScript provides the
async and await
keywords
let seqId = 0
exports.handler = async (event) => {
    console.log(`Starting: sequence Id=${++seqId}`)
    const result = await doWork(seqId)
    console.log(`Work done: sequence Id=${result}`)
}

function doWork(id) {
  return new Promise(resolve => {
    setTimeout(() => resolve(id), 4000)
  })
}
Using this syntax prevents the handler from exiting before the asynchronous function is finished. In this case, if the callback takes longer than the Lambda function’s timeout, the function will throw an error, instead of returning the callback result in a later invocation:

-
The code calls the asynchronous
doWorkfunction using the await keyword in the handler. -
The
doWorkfunction takes some period of time to complete before resolving the promise. -
The function times out because
doWorktakes longer than the timeout limit allows and the callback result is not returned in a later invocation.
Generally, you should make sure any background processes or callbacks in the code are complete before the code exits. If this is not possible in your use case, you can use an identifier to ensure that the callback belongs to the current invocation. To do this, you can use the awsRequestId provided by the context object. By passing this value to the asynchronous callback, you can compare the passed value with the current value to detect if the callback originated from another invocation:
let currentContext

exports.handler = async (event, context) => {
    console.log(`Starting: request id=$\{context.awsRequestId}`)
    currentContext = context

    doWork(context.awsRequestId, function(id) {
        if (id != currentContext.awsRequestId) {
            console.info(`This callback is from another invocation.`)
        }
    })

}

function doWork(id, callback) {
    setTimeout(() => callback(id), 3000)

}

-
The Lambda function handler takes the context parameter, which provides access to a unique invocation request ID.
-
The
awsRequestIdis passed to the doWork function. In the callback, the ID is compared with theawsRequestIdof the current invocation. If these values are different, the code can take action accordingly.
