We are no longer updating the Amazon Machine Learning service or accepting new users for it. This documentation is available for existing users, but we are no longer updating it. For more information, see What is Amazon Machine Learning.
Binary Model Insights
Interpreting the Predictions
The actual output of many binary classification algorithms is a prediction score. The score indicates the system's certainty that the given observation belongs to the positive class (the actual target value is 1). Binary classification models in Amazon ML output a score that ranges from 0 to 1. As a consumer of this score, to make the decision about whether the observation should be classified as 1 or 0, you interpret the score by picking a classification threshold, or cut-off, and compare the score against it. Any observations with scores higher than the cut-off are predicted as target= 1, and scores lower than the cut-off are predicted as target= 0.
In Amazon ML, the default score cut-off is 0.5. You can choose to update this cut-off to match your business needs. You can use the visualizations in the console to understand how the choice of cut-off will affect your application.
Measuring ML Model Accuracy
Amazon ML provides an industry-standard accuracy metric for binary classification models called Area Under the (Receiver Operating Characteristic) Curve (AUC). AUC measures the ability of the model to predict a higher score for positive examples as compared to negative examples. Because it is independent of the score cut-off, you can get a sense of the prediction accuracy of your model from the AUC metric without picking a threshold.
The AUC metric returns a decimal value from 0 to 1. AUC values near 1
indicate an ML model that is highly accurate. Values near 0.5 indicate
an ML model that is no better than guessing at random. Values near 0 are
unusual to see, and typically indicate a problem with the data.
Essentially, an AUC near 0 says that the ML model has learned the
correct patterns, but is using them to make predictions that are flipped
from reality ('0's are predicted as '1's and vice versa). For more
information about AUC, go to the Receiver operating
characteristic
The baseline AUC metric for a binary model is 0.5. It is the value for a hypothetical ML model that randomly predicts a 1 or 0 answer. Your binary ML model should perform better than this value to begin to be valuable.
Using the Performance Visualization
To explore the accuracy of the ML model, you can review the graphs on the Evaluation page on the Amazon ML console. This page shows you two histograms: a) a histogram of the scores for the actual positives (the target is 1) and b) a histogram of scores for the actual negatives (the target is 0) in the evaluation data.
An ML model that has good predictive accuracy will predict higher scores to the actual 1s and lower scores to the actual 0s. A perfect model will have the two histograms at two different ends of the x-axis showing that actual positives all got high scores and actual negatives all got low scores. However, ML models make mistakes, and a typical graph will show that the two histograms overlap at certain scores. An extremely poor performing model will be unable to distinguish between the positive and negative classes, and both classes will have mostly overlapping histograms.
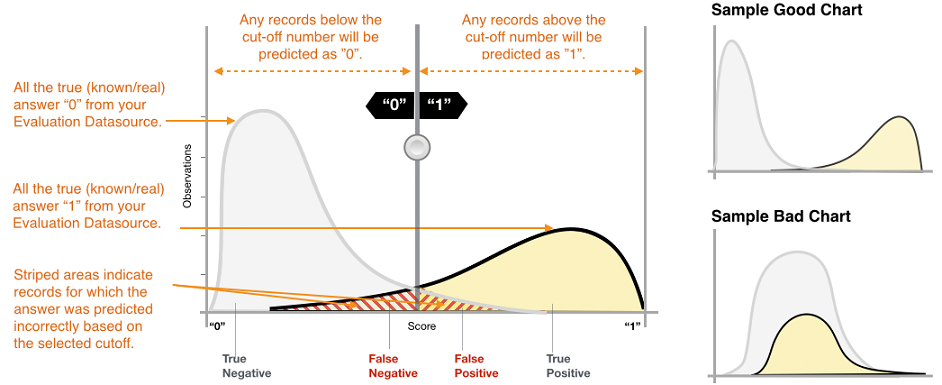
Using the visualizations, you can identify the number of predictions that fall into the two types of correct predictions and the two types of incorrect predictions.
Correct Predictions
-
True positive (TP): Amazon ML predicted the value as 1, and the true value is 1.
-
True negative (TN): Amazon ML predicted the value as 0, and the true value is 0.
Erroneous Predictions
-
False positive (FP): Amazon ML predicted the value as 1, but the true value is 0.
-
False negative (FN): Amazon ML predicted the value as 0, but the true value is 1.
Note
The number of TP, TN, FP, and FN depends on the selected score threshold, and optimizing for any of one of these numbers would mean making a tradeoff on the others. A high number of TPs typically results in a high number of FPs and a low number of TNs.
Adjusting the Score Cut-off
ML models work by generating numeric prediction scores, and then applying a cut-off to convert these scores into binary 0/1 labels. By changing the score cut-off, you can adjust the model's behavior when it makes a mistake. On the Evaluation page in the Amazon ML console, you can review the impact of various score cut-offs, and you can save the score cut-off that you would like to use for your model.
When you adjust the score cut-off threshold, observe the trade-off between the two types of errors. Moving the cut-off to the left captures more true positives, but the trade-off is an increase in the number of false positive errors. Moving it to the right captures less of the false positive errors, but the trade-off is that it will miss some true positives. For your predictive application, you make the decision which kind of error is more tolerable by selecting an appropriate cut-off score.
Reviewing Advanced Metrics
Amazon ML provides the following additional metrics to measure the predictive accuracy of the ML model: accuracy, precision, recall, and false positive rate.
Accuracy
Accuracy (ACC) measures the fraction of correct predictions. The range is 0 to 1. A larger value indicates better predictive accuracy:

Precision
Precision measures the fraction of actual positives among those examples that are predicted as positive. The range is 0 to 1. A larger value indicates better predictive accuracy:

Recall
Recall measures the fraction of actual positives that are predicted as positive. The range is 0 to 1. A larger value indicates better predictive accuracy:

False Positive Rate
The false positive rate (FPR) measures the false alarm rate or the fraction of actual negatives that are predicted as positive. The range is 0 to 1. A smaller value indicates better predictive accuracy:

Depending on your business problem, you might be more interested in a model that performs well for a specific subset of these metrics. For example, two business applications might have very different requirements for their ML model:
-
One application might need to be extremely sure about the positive predictions actually being positive (high precision), and be able to afford to misclassify some positive examples as negative (moderate recall).
-
Another application might need to correctly predict as many positive examples as possible (high recall), and will accept some negative examples being misclassified as positive (moderate precision).
Amazon ML allows you to choose a score cut-off that corresponds to a particular value of any of the preceding advanced metrics. It also shows the tradeoffs incurred with optimizing for any one metric. For example, if you select a cut-off that corresponds to a high precision, you typically will have to trade that off with a lower recall.
Note
You have to save the score cut-off for it to take effect on classifying any future predictions by your ML model.
