We are no longer updating the Amazon Machine Learning service or accepting new users for it. This documentation is available for existing users, but we are no longer updating it. For more information, see What is Amazon Machine Learning.
Regression Model Insights
Interpreting the Predictions
The output of a regression ML model is a numeric value for the model's prediction of the target. For example, if you are predicting housing prices, the prediction of the model could be a value such as 254,013.
Note
The range of predictions can differ from the range of the target in the training data. For example, let's say you are predicting housing prices, and the target in the training data had values in a range from 0 to 450,000. The predicted target need not be in the same range, and might take any positive value (greater than 450,000) or negative value (less than zero). It is important to plan how to address prediction values that fall outside a range that is acceptable for your application.
Measuring ML Model Accuracy
For regression tasks, Amazon ML uses the industry standard root mean square error (RMSE) metric. It is a distance measure between the predicted numeric target and the actual numeric answer (ground truth). The smaller the value of the RMSE, the better is the predictive accuracy of the model. A model with perfectly correct predictions would have an RMSE of 0. The following example shows evaluation data that contains N records:

Baseline RMSE
Amazon ML provides a baseline metric for regression models. It is the RMSE for a hypothetical regression model that would always predict the mean of the target as the answer. For example, if you were predicting the age of a house buyer and the mean age for the observations in your training data was 35, the baseline model would always predict the answer as 35. You would compare your ML model against this baseline to validate if your ML model is better than a ML model that predicts this constant answer.
Using the Performance Visualization
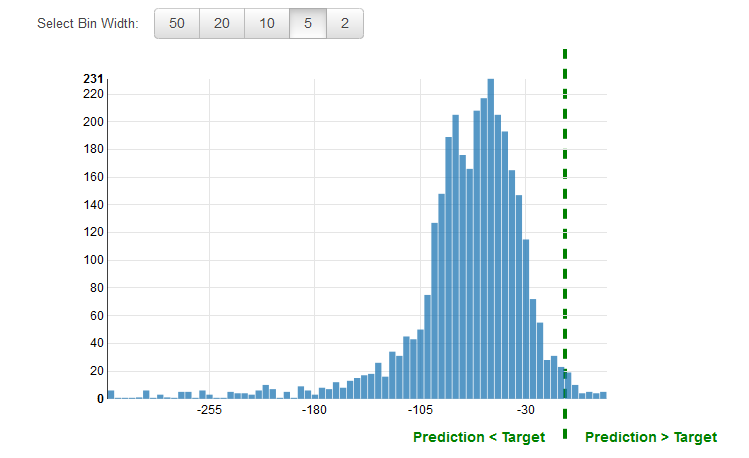
It is common practice to review the residuals for regression problems. A residual for an observation in the evaluation data is the difference between the true target and the predicted target. Residuals represent the portion of the target that the model is unable to predict. A positive residual indicates that the model is underestimating the target (the actual target is larger than the predicted target). A negative residual indicates an overestimation (the actual target is smaller than the predicted target). The histogram of the residuals on the evaluation data when distributed in a bell shape and centered at zero indicates that the model makes mistakes in a random manner and does not systematically over or under predict any particular range of target values. If the residuals do not form a zero-centered bell shape, there is some structure in the model's prediction error. Adding more variables to the model might help the model capture the pattern that is not captured by the current model. The following illustration shows residuals that are not centered around zero.