Visualizing data sensitivity with the S3 buckets map
On the Amazon Macie console, the S3 buckets heat map provides an interactive, visual representation of data sensitivity across your Amazon Simple Storage Service (Amazon S3) data estate. It captures the results of automated sensitive data discovery activities that Macie has performed thus far for your Amazon S3 data in the current AWS Region.
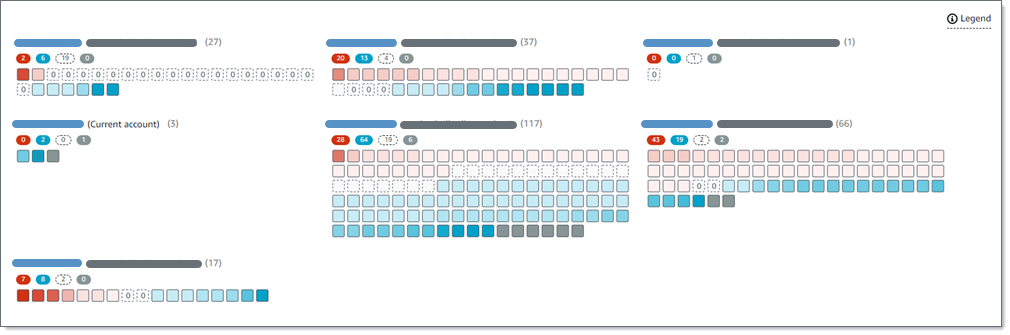
If you're the Macie administrator for an organization, the map includes results for S3 buckets that your member accounts own. The data is grouped by AWS account and sorted by account ID, as shown in the following image.
The map displays data for up to 100 S3 buckets for each account. To display data for all buckets, you can switch to table view and review the data in tabular format instead.
To display the map, choose S3 buckets in the navigation pane on the
console. Then choose map (
 ) at the top of the page. The map is available only if
automated sensitive data discovery is currently enabled. It doesn't include the results of sensitive data discovery jobs
that you create and run.
) at the top of the page. The map is available only if
automated sensitive data discovery is currently enabled. It doesn't include the results of sensitive data discovery jobs
that you create and run.
Interpreting data in the S3 buckets map
In the S3 buckets map, each square represents an S3 general purpose bucket in your bucket inventory. The color of a square represents a bucket's current sensitivity score, which measures the intersection of two primary dimensions: the amount of sensitive data that Macie has found in the bucket, and the amount of data that Macie has analyzed in the bucket. The intensity of the color's hue represents where a score falls in a range of data sensitivity values, as shown in the following image.

In general, you can interpret color and hue intensity as follows:
-
Blue – If a bucket's current sensitivity score ranges from 1 through 49, the bucket's square is blue and the bucket's sensitivity label is Not sensitive. The intensity of the blue hue reflects the number of unique objects that Macie has analyzed in the bucket relative to the total number of unique objects in the bucket. A darker hue indicates a lower sensitivity score.
-
No color – If a bucket's current sensitivity score is 50, the bucket's square isn't colored and the bucket's sensitivity label is Not yet analyzed. In addition, the square has a dashed border.
-
Red – If a bucket's current sensitivity score ranges from 51 through 100, the bucket's square is red and the bucket's sensitivity label is Sensitive. The intensity of the red hue reflects the amount of sensitive data that Macie has found in the bucket. A darker hue indicates a higher sensitivity score.
-
Gray – If a bucket's current sensitivity score is -1, the bucket's square is dark gray and the bucket's sensitivity label is Classification error. Hue intensity doesn't vary.
For details about the range of sensitivity scores and labels that Macie defines, see Sensitivity scoring for S3 buckets.
In the map, the square for an S3 bucket might also contain a symbol. The symbol indicates an error, issue, or other type of consideration that might affect your evaluation of a bucket's sensitivity. A symbol can also indicate a potential issue with the security of the bucket—for example, the bucket is publicly accessible. The following table lists the symbols that Macie uses to notify you of these cases.
| Symbol | Definition | Description |
|---|---|---|
|
|
Access denied |
Macie isn't allowed to access the bucket or the bucket's objects. Consequently, Macie can't analyze any objects in the bucket. This issue typically occurs because a bucket has a restrictive bucket policy. For information about how to address this issue, see Allowing Macie to access S3 buckets and objects. |
|
|
Publicly accessible |
The general public has read or write access to the bucket. To make this determination, Macie analyzes a combination of settings for each bucket, such as the block public access settings for the account and the bucket, and the bucket policy for the bucket. Macie can do this for up to 10,000 buckets for an account. For more information, see How Macie monitors Amazon S3 data security. |
|
|
Unclassifiable |
Macie can't analyze any objects in the bucket. All the bucket's objects use Amazon S3 storage classes that Macie doesn't support, or they have file name extensions for file or storage formats that Macie doesn't support. For Macie to analyze an object, the object must use a supported storage class and have a file name extension for a supported file or storage format. For more information, see Supported storage classes and formats. |
|
|
Zero bytes |
The bucket doesn't store any objects for Macie to analyze. The bucket is empty or all the objects in the bucket contain zero (0) bytes of data. |
Interacting with the S3 buckets map
As you review the S3 buckets map, you can interact with it in different ways to reveal and evaluate additional data and details for individual accounts and buckets. Follow these steps to display the map and use various features that it provides.
To interact with the S3 buckets map
Open the Amazon Macie console at https://console.aws.amazon.com/macie/
. -
In the navigation pane, choose S3 buckets. The S3 buckets page displays a map of your bucket inventory. If the page displays your inventory in tabular format instead, choose map (
) at the top of the
page.By default, the map doesn't display data for buckets that are currently excluded from automated sensitive data discovery. If you're the Macie administrator for an organization, it also doesn't display data for accounts that automated sensitive data discovery is currently disabled for. To display this data, choose X in the Is monitored by automated discovery filter token below the filter box.
-
At the top of the page, optionally choose refresh (
 ) to retrieve the latest
bucket metadata from Amazon S3.
) to retrieve the latest
bucket metadata from Amazon S3. -
In the S3 buckets map, do any of the following:
-
To determine how many buckets have a specific sensitivity label, refer to the colored badges immediately below an AWS account ID. The badges display aggregated bucket counts, broken down by sensitivity label.
For example, the red badge reports the total number of buckets that are owned by the account and have the Sensitive label. The sensitivity score for these buckets ranges from 51 through 100. The blue badge reports the total number of buckets that are owned by the account and have the Not sensitive label. The sensitivity score for these buckets ranges from 1 through 49.
-
To review a subset of information about a bucket, hover over the bucket's square. A popover displays the bucket's name and current sensitivity score.
The popover also displays the total number of objects that Macie can analyze in the bucket and the total storage size of the latest version of those objects. These objects are classifiable. They use supported Amazon S3 storage classes and they have file name extensions for supported file or storage formats. For more information, see Supported storage classes and formats.
-
To filter the map and display only those buckets that have a specific value for a field, place your cursor in the filter box, and then add a filter condition for the field. Macie applies the condition's criteria and displays the condition below the filter box. To further refine the results, add filter conditions for additional fields. For more information, see Filtering your S3 bucket inventory.
-
To drill down and display only those buckets that are owned by a particular account, choose the account ID for the account. Macie opens a new tab that filters and displays data only for that account.
-
-
To review data sensitivity statistics and other information for a particular bucket, choose the bucket's square. Then refer to the details panel. For information about these details, see Reviewing data sensitivity details for S3 buckets.
Tip
On the Bucket details tab of the panel, you can pivot and drill down on many of the fields. To show buckets that have the same value for a field, choose
 in the field. To show buckets that have other values for a field,
choose
in the field. To show buckets that have other values for a field,
choose
 in the field.
