Step 4.3: Monitor MyStack
Important
The AWS OpsWorks Stacks service reached end of life on May 26, 2024 and has been disabled for both new and existing customers.
We strongly recommend customers migrate their workloads to other solutions as soon as possible. If you have questions about migration, reach out to the AWS Support Team on AWS re:Post
OpsWorks Stacks uses Amazon CloudWatch to provide metrics for a stack and summarizes them for your convenience on the Monitoring page. You can view metrics for the entire stack, a specified layer, or a specified instance.
To monitor MyStack
-
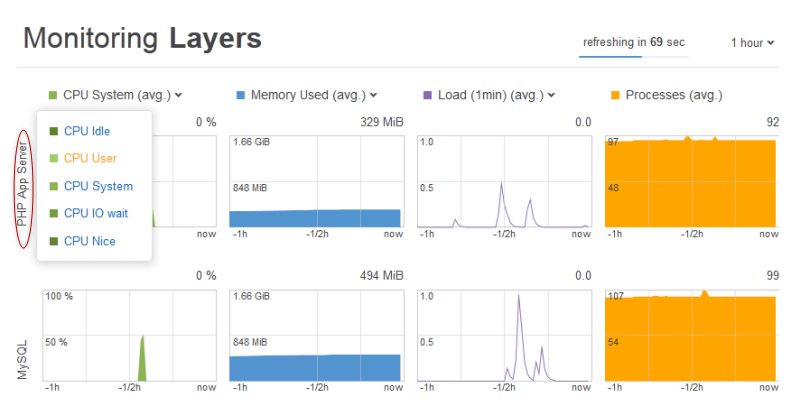
In the navigation pane, click Monitoring, which displays a set of graphs with average metrics for each layer. You can use the menus for CPU System, Memory Used, and Load to display different related metrics.
-
Click PHP App Server to see metrics for each of the layer's instances.

-
Click php-app1 to see metrics for that instance. You can see metrics for any particular point in time by moving the slider.

Note
OpsWorks Stacks also supports the Ganglia monitoring server, which might have advantages for some applications. For more information, see Ganglia Layer.
