Monitoring Stacks using Amazon CloudWatch
Important
The AWS OpsWorks Stacks service reached end of life on May 26, 2024 and has been disabled for both new and existing customers.
We strongly recommend customers migrate their workloads to other solutions as soon as possible. If you have questions about migration, reach out to the AWS Support Team on AWS re:Post
OpsWorks Stacks uses Amazon CloudWatch (CloudWatch) to provide monitoring for stacks.
-
For Linux stacks, OpsWorks Stacks supports thirteen custom metrics to provide detailed monitoring for each instance in the stack and summarizes the data for your convenience on the Monitoring page.
-
For Windows stacks, you can monitor standard Amazon EC2 metrics for your instances with the CloudWatch console
. The Monitoring page does not display Windows metrics.
The Monitoring page displays metrics for an entire stack, a layer, or an instance. OpsWorks Stacks metrics are distinct from Amazon EC2 metrics. You can also enable additional metrics through the CloudWatch console, but they typically require additional charges. You can also view the underlying data on the CloudWatch console, as follows:
To view OpsWorks custom metrics in CloudWatch
Open the CloudWatch console at https://console.aws.amazon.com/cloudwatch/
. -
On the navigation bar, select the stack's region.
-
In the navigation pane, choose Metrics.
-
In OpsWorks Metrics, choose Instance Metrics, Layer Metrics, or Stack Metrics.

Note
OpsWorks Stacks collects metrics by running a process on each instance (the instance agent). Because CloudWatch collects metrics differently, using the hypervisor, the values in the CloudWatch console might differ slightly from the corresponding values on the Monitoring page in the OpsWorks Stacks console.
You can also use CloudWatch console to set alarms. For more information about how to create alarms, see Creating Amazon CloudWatch Alarms. For a list of CloudWatch custom metrics, see AWS OpsWorks Metrics and Dimensions. For more information, see Amazon CloudWatch.
Topics
AWS OpsWorks Stacks Metrics
OpsWorks Stacks sends the following metrics to CloudWatch every five minutes.
| Metric | Description |
|---|---|
|
|
The percentage of time that the CPU is idle. Valid Dimensions: The IDs of the individual resources for which you are viewing metrics: StackId, LayerId, or InstanceId. Valid Statistics: Unit: None |
|
|
The percentage of time that the CPU is handling processes with a positive Valid Dimensions: The IDs of the individual resources for which you are viewing metrics: StackId, LayerId, or InstanceId. Valid Statistics: Unit: None |
|
|
As AWS allocates hypervisor CPU resources among increasing numbers of instances, virtualization load rises,
and can affect how often the hypervisor can perform requested work on an instance. Valid Dimensions: The IDs of the individual resources for which you are viewing metrics: StackId, LayerId, or InstanceId. Valid Statistics: Unit: None |
|
|
The percentage of time that the CPU is handling system operations. Valid Dimensions: The IDs of the individual resources for which you are viewing metrics: StackId, LayerId, or InstanceId. Valid Statistics: Unit: None |
|
|
The percentage of time that the CPU is handling user operations. Valid Dimensions: The IDs of the individual resources for which you are viewing metrics: StackId, LayerId, or InstanceId. Valid Statistics: Unit: None |
|
|
The percentage of time that the CPU is waiting for input/output operations. Valid Dimensions: The IDs of the individual resources for which you are viewing metrics: StackId, LayerId, or InstanceId. Valid Statistics: Unit: None |
| Metric | Description |
|---|---|
|
|
The amount of buffered memory. Valid Dimensions: The IDs of the individual resources for which you are viewing metrics: StackId, LayerId, or InstanceId. Valid Statistics: Unit: None |
|
|
The amount of cached memory. Valid Dimensions: The IDs of the individual resources for which you are viewing metrics: StackId, LayerId, or InstanceId. Valid Statistics: Unit: None |
|
|
The amount of free memory. Valid Dimensions: The IDs of the individual resources for which you are viewing metrics: StackId, LayerId, or InstanceId. Valid Statistics: Unit: None |
|
|
The amount of swap space. Valid Dimensions: The IDs of the individual resources for which you are viewing metrics: StackId, LayerId, or InstanceId. Valid Statistics: Unit: None |
|
|
The total amount of memory. Valid Dimensions: The IDs of the individual resources for which you are viewing metrics: StackId, LayerId, or InstanceId. Valid Statistics: Unit: None |
|
|
The amount of memory in use. Valid Dimensions: The IDs of the individual resources for which you are viewing metrics: StackId, LayerId, or InstanceId. Valid Statistics: Unit: None |
| Metric | Description |
|---|---|
|
|
The load averaged over a one-minute window. Valid Dimensions: The IDs of the individual resources for which you are viewing metrics: StackId, LayerId, or InstanceId. Valid Statistics: Unit: None |
|
|
The load averaged over a five-minute window. Valid Dimensions: The IDs of the individual resources for which you are viewing metrics: StackId, LayerId, or InstanceId. Valid Statistics: Unit: None |
|
|
The load averaged over a 15-minute window. Valid Dimensions: The IDs of the individual resources for which you are viewing metrics: StackId, LayerId, or InstanceId. Valid Statistics: Unit: None |
| Metric | Description |
|---|---|
|
|
The number of active processes. Valid Dimensions: The IDs of the individual resources for which you are viewing metrics: StackId, LayerId, or InstanceId. Valid Statistics: Unit: None |
Dimensions for OpsWorks Stacks Metrics
OpsWorks Stacks metrics use the OpsWorks Stacks namespace, and provide metrics for the following dimensions:
| Dimension | Description |
|---|---|
|
|
Average values for a stack. |
|
|
Average values for a layer. |
|
|
Average values for an instance. |
Stack Metrics
To view a summary of metrics for an entire stack, select a stack in the OpsWorks Stacks Dashboard and then click Monitoring in the navigation pane. The following example is for a stack with a PHP and a DB layer.
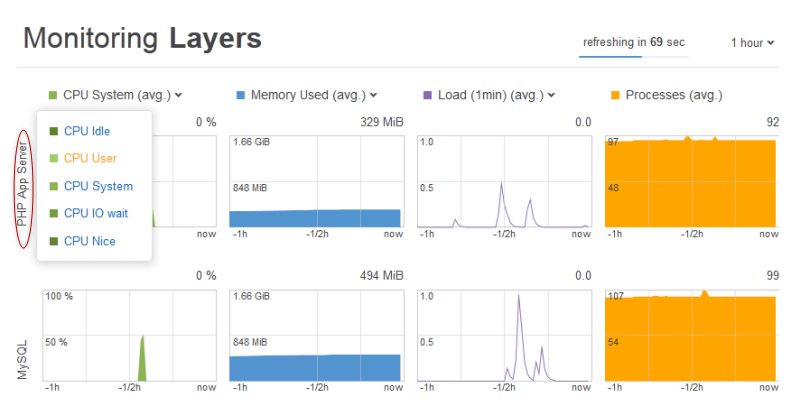
The stack view displays graphs of the four types of metrics for each layer over a specified time period: 1 hour, 8 hours, 24 hours, 1 week, or 2 weeks. Note the following:
-
OpsWorks Stacks periodically updates the graphs; the countdown timer at the upper right indicates the time remaining until the next update,
-
If a layer has more than one instance, the graphs display average values for the layer.
-
You can specify the time period by clicking the list at the upper right and selecting your preferred value.
For each metric type, you can use the list at the top of the graph to select the particular metric that you want to view.
Layer Metrics
To view metrics for a particular layer, click the layer name in the Monitoring Layers view. The following example shows metrics for the PHP layer, which has two instances.

The metric types are the same as for the stack metrics, and for each type, you can use the list at the top of the graph to select the particular metric that you want to view.
Note
You can also display layer metrics by going to the layer's details page and clicking Monitoring at the upper right.
Instance Metrics
To view metrics for a particular instance, click the instance name in the layer monitoring view. The following example shows metrics for the PHP layer's php-app1 instance.

The graphs summarize all the available metrics for each metric type. To get exact values for a particular point in time, use your mouse to move the slider (indicated by the red arrow in the previous illustration) to the appropriate position.
Note
You can also display instance metrics by going to the instance's details page and choosing Monitoring at the upper right.
