End of support notice: On October 30, 2026, AWS will end support for Amazon Pinpoint. After October 30, 2026, you will no longer be able to access the Amazon Pinpoint console or Amazon Pinpoint resources (endpoints, segments, campaigns, journeys, and analytics). For more information, see Amazon Pinpoint end of support. Note: APIs related to SMS, voice, mobile push, OTP, and phone number validate are not impacted by this change and are supported by AWS End User Messaging.
View journey metrics
After you publish a journey, the Journey metrics pane appears in the journey workspace, and Amazon Pinpoint begins to capture metrics related to the journey.
Topics
Journey-level execution metrics
Journey-level execution metrics include information about the endpoints that entered (or were prevented from entering) your journey. To view engagement metrics, choose Engagement metrics in the Journey metrics pane.
These metrics are divided into several sections, which are discussed in detail in the following sections.
Entry metrics
The first section in the list of journey execution metrics shows how many participants entered your journey. An example of this section is shown in the following image.

This section contains the following information:
-
Currently in journey – The number of participants who are actively proceeding through the activities in the journey.
-
Completed journey – The number of participants who have reached an end activity in the journey.
-
Lifetime journey entries – The number of participants who have entered the journey since the start date of the journey. This section also contains a chart that shows the percentage of participants who completed the journey (shown in blue) and the percentage of participants who are still in the journey (shown in orange).
Journey refresh metrics
This section shows the refresh metrics for the journey. It includes information about the number of segments refreshed, how many times a segment has been refreshed, and whether the segment is set to refresh on update or not. An example of this section is shown in the following image.

This section contains the following information:
-
Total journey entries – The total number of journey entries.
-
Next entry group - estimate – The number of endpoints that will be added on the next update. If a segment refresh interval isn't set, there will be no endpoints to add. The value displays as N/A.
-
Does not refresh on segment update/ Refreshes on update – Indicates whether Refresh on segment update was chosen when adding endpoints for the journey entry activity.
-
Number of times entry segment will be refreshed – The maximum number of times that the segment will be refreshed during the journey.
-
Number of times entry segment has been refreshed since start – The current number of times the segment has been refreshed since the journey started.
-
Removed due to re-evaluation – The number of endpoints that were removed from the journey because of the re-evaluation process that occurs when a participant reaches a Send contact center activity. For more information, see Set up a contact center activity.
Unsent Message Metrics
The next section in the list of journey execution metrics includes information about the reasons why messages weren't sent to journey participants. An example of this section is shown in the following image.
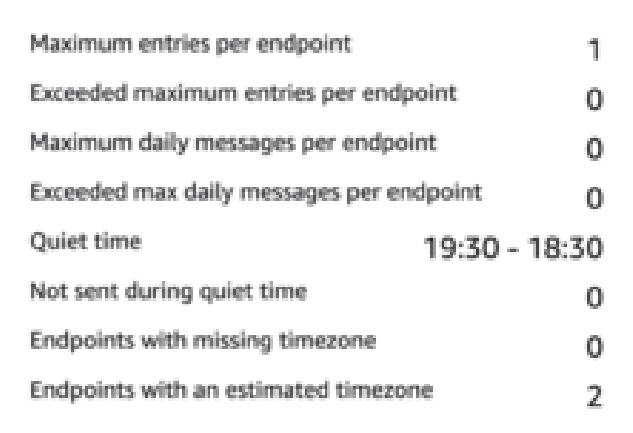
This section contains the following information:
-
Maximum entries per endpoint/Exceeded maximum entries per endpoint – Displays the maximum number of entries per endpoint and the number of participants who were prevented from participating in the journey because they would have exceeded the maximum number of times that a single endpoint can participate in the journey.
-
Maximum daily messages per endpoint/Exceeded max daily messages per endpoint – Displays the maximum number of daily messages per endpoint, and the number of messages that weren't sent because sending them would have exceeded the maximum number of messages that a single participant can receive during a 24-hour period.
-
Quiet time/Not sent during quiet time – Displays the current quiet time hours set for the journey, and the number of messages that weren't sent for the following reasons.
-
If Resume sending after quiet times is not turned on and sending is blocked due to encountering the quiet time window.
If Time zone estimation is turned on and sending is blocked due to the endpoint having no time zone (result of missing
Demographic.Timezoneattribute and unsuccessful time zone estimation).
-
Activity-level execution metrics
Activity-level execution metrics include information about the endpoints that entered (or were prevented from entering) your activity. Select an individual activity to view its execution metrics. To view engagement metrics, choose Engagement metrics in the Journey metrics pane.
Important
The number of endpoints that move through each activity in your journey is noted in the top right corner of each activity modal.
These metrics are divided into several sections, which are discussed in detail in the following sections.
Sent message metrics
The first section in the list of activity execution metrics shows how many endpoints entered your activity. An example of this section is shown in the following image.

This section contains the following information:
-
Messages sent – The number of messages sent.
-
Messages not sent – The number of messages not sent.
Unsent Message Metrics
Each activity in your journey includes a list of execution metrics that indicates information about the number of messages that couldn't be delivered because of system issues, Amazon Pinpoint account configuration, or end user preferences such as an opt-out. An example of this section is shown in the following image.

This section contains the following information:
-
Not sent during quiet time – The number of messages that weren't sent because they would have been delivered during quiet time in the recipient's time zone.
-
Exceeded endpoint message limit – The number of messages that weren't sent because sending them would have exceeded the maximum number of messages that a single participant can receive during a 24-hour period.
-
Throttled – The number of messages that weren't sent because sending them would exceed the sending quotas for your Amazon Pinpoint account.
-
Temporary failure – The number of messages that weren't sent because of a temporary failure.
-
Service failure – The number of messages that weren't sent because of an issue with the Amazon Pinpoint service.
-
Permanent failure – The number of messages that weren't sent because of a permanent failure.
-
Unsupported channel – The number of endpoints that weren’t sent through the activity because the endpoint didn't match the activity type.
-
Unknown failure – The number of messages that weren't sent because of an unknown reason.
-
Custom delivery failure – The number of messages that weren't sent because of a Lambda function or webhook failure.
Note
This metric only appears on Send through a custom channel activities.
-
Dial failure – The number of messages that couldn't be delivered through a Send through a contact center activity because an issue prevented the number from being dialed. This type of failure can occur if there are permissions issues that prevent the call from being made, if an Amazon Connect service quota has been exceeded, or if a transient service issue occurs.
-
Removed due to re-evaluation – The number of endpoints that were removed from the journey because of the re-evaluation process that occurs when a participant reaches a Send through a contact center activity. For more information, see Set up a contact center activity.
Note
The Dial failure and Removed due to re-evaluation metrics only appear on Send through a contact center activities.
-
Quiet time/Not sent during quiet time – Displays the current quiet time hours set for the journey, and the number of messages that weren't sent for the following reasons.
-
If Resume sending after quiet times isn't turned on and sending is blocked due to encountering the quiet time window.
If Time zone estimation is turned on and sending is blocked due to the endpoint having no time zone (result of missing
Demographic.Timezoneattribute and unsuccessful time zone estimation).
-
Journey-Level engagement metrics
Journey-level engagement metrics include information about the ways in which the participants in your journey interacted with the messages that were sent from the journey.
These metrics are divided into several sections, which are discussed in detail in the following sections.
Important
Several of the engagement metrics are based on information that we receive from recipients' email providers or mobile phone carriers or from push notification services, such as Apple Push Notification service or Firebase Cloud Messaging. After we receive this data from these sources, there is a delay of up to two hours while we process the incoming metrics.
Number of message activities
The engagement metrics for each journey provide the number of message activities in that journey.
If there are multiple activity types in the journey, the engagement metrics are broken down by type, as seen in the following image.

Activity-level engagement metrics
Activity-level engagement metrics include information about the ways in which the participants in your journey interacted with the messages that were sent from the journey.
These metrics are divided into several sections, which are discussed in detail in the following sections.
Email activities provide the following engagement metrics.
Response metrics
These metrics provide information about participants' interactions with the messages that were sent from the email message activity.

This section contains the following information:
-
Total messages sent – The number of emails sent from this activity, whether the messages were successfully delivered to the recipients’ inboxes.
-
Total deliveries – The number of messages that were delivered to recipients' email providers.
-
Total opens – The number of messages that were opened by recipients.
Note
For Amazon Pinpoint to count an email open event, the recipient must load the images in your messages. Several email clients, such as some versions of Microsoft Outlook, prevent images from being loaded by default.
If a message is opened once or opened multiple times within the same hour, it will be counted as one open. Multiple opens taking place at different hours will be counted as separate opens. For example, if a message is opened at 8:30 AM and 8:45 AM, it will count as one open but if the messaged is opened at 8:30 AM and 9:05 AM, it will count as two opens because the hour has changed. For this reason, it's possible (but unlikely) for the number of opens to exceed the number of sends or deliveries.
-
Total clicks – The number of times that recipients clicked links in messages.
Note
If a message recipient clicks multiple links in a message or clicks the same link more than once, those clicks will be counted as one click if they occur within the same hour. Multiple clicks taking place at different hours will be counted as separate clicks. For example, a link is clicked at 8:30 AM and 8:45 AM it will count as one click but if the link is clicked at 8:30 AM and 9:05 AM it will count as two clicks because the hour has changed. For this reason, it's possible for the number of clicks to exceed the number of opens or deliveries.
Message engagement metrics
The final section in the list of engagement metrics provides additional email response metrics. An example of this section is shown in the following image.

This section contains the following information:
-
Emails soft bounced – The number of messages that resulted in a soft bounce. A soft bounce occurs when a message can't be delivered because of a temporary issue (for example, when the recipient's inbox is full).
Note
Amazon Pinpoint attempts to re-deliver messages that result in a soft bounce for a certain period of time. If the message is delivered during one of these redelivery attempts, then the message is counted in the Total deliveries metric and removed from the Emails soft bounced metric.
-
Emails hard bounced – The number of messages that resulted in a hard bounce. A hard bounce occurs when a message can't be delivered because of a permanent issue (for example, when the destination email address no longer exists).
Note
Soft bounces that can't be delivered after a certain period of time are converted to hard bounces. For this reason, you might see the number of soft bounces decrease and the number of hard bounces increase.
-
Emails unsubscribed – The number of messages that prompted the recipient to unsubscribe.
Note
For Amazon Pinpoint to count an unsubscribe event, the unsubscribe link in the email has to contain a special link tag (a tag called
unsubscribeLinkTag, as in the following example:<a ses:tags="unsubscribeLinkTag:click;" href="http://www.example.com/unsubscribe">). Only links that contain this tag are counted as unsubscribes. -
Emails complained – The number of messages that were reported by the recipient as unsolicited mail.
Note
This metric is based on complaint report data that we receive from recipients' email providers. Some email providers send us complaint data immediately, while others send a weekly or monthly digest.
-
Emails rejected – The number of messages that weren't sent because they were rejected. A message is rejected if Amazon Pinpoint determines that the message contains malware. Amazon Pinpoint doesn't attempt to send rejected messages.
SMS message activities provide the following engagement metrics.
Delivery metrics
These metrics provide information about participants' interactions with the messages that were sent from the SMS message activity.

This section contains the following information:
-
Total messages sent – The number of SMS messages sent from this activity, whether the messages were successfully delivered to the recipients’ devices.
-
Total deliveries – The number of SMS messages delivered from the provider to the recipients' devices.
-
Total failures – The number of SMS messages that failed to be delivered to recipients.
-
Total SMS activity spend – The estimated amount of money you've spent sending SMS messages through this activity.
Push notification activities provide the following engagement metrics.
Response Metrics
These metrics provide information about participants' interactions with the messages that were sent from the push notification activity.

This section contains the following information:
-
Total messages sent – The number of push notifications sent from this activity, whether the messages were successfully delivered to the recipients’ devices.
-
Total deliveries – The number of push notifications delivered from the push notification service to the recipients' devices. This metric only reflects deliveries that are made when an app is running in the foreground or background of a recipient's device. Due to discrepancies in how mobile operating systems prioritize background notifications, delivery of push notifications are not guaranteed.
-
Total opens – The number of push notifications that were opened by recipients.
Time to Live Metrics
The push notification engagement metrics also provide the time to live (TTL) value for the push notification activity. The TTL is the amount of time, in seconds, during which Amazon Pinpoint can deliver the message. After this time elapses, Amazon Pinpoint drops the message and doesn't attempt to re-deliver it.

When the default TTL value is used, the metric displays a “-”. For custom TTL values, the metric displays the exact number and unit of time that you chose.
Custom channel activities provide the following engagement metrics.
Call Success Metrics
These metrics provide information about participants' interactions with the messages that were sent from the custom channel activity.

This section contains the following information:
-
Call to function or webhook succeeded – The number of times that a Lambda function or webhook was successfully invoked because of this activity.
Note
This doesn't indicate that the message was delivered to the destination, it only indicates that the Lambda function or webhook was called.
-
Call to webhook or function failed – The number of times that a Lambda function or webhook was not successfully invoked because of this activity.
You can use Contact center activity metrics to analyze participants' interactions with your calls.
Contact center metrics
The following call metrics are available:
-
Total successful dials – The total number of calls that were successfully dialed.
-
Connected – The number of calls that connected to an agent. If answering machine detection is enabled, then calls received by answering machines won't be included in the Connected metric. Otherwise, if answering machine detection is disabled they are included. For more information about answering machine detection, see AnswerMachine DetectionConfig in the Amazon Connect Outbound Campaigns API Reference.
-
SIT tone – The number of calls that received a busy tone.
-
Fax – The number of calls that received a fax tone.
-
Voicemail beep – The number of calls that reached voice mail with a beep sound.
-
Voicemail no beep – The number of calls that reached voice mail without a beep sound.
-
Not answered – The number of calls that received a response, but the call continued to ring without reaching voice mail.
-
Connection error – The number of calls that received a response, but the call could not reach voice mail.
-
Connection rate – The rate of calls that successfully connected to an agent as compared to all successful dials.
-
Total failed dials – The number of calls that failed due to system issues, telecom issues, or permission errors.
-
Total expired dials – The number of calls that expired because the dialer faced an error or there were no agents available.
Activity metrics
In addition to viewing metrics for channel-specific activity types (email, SMS, push, and custom channels), you can also view metrics for other activity types, which include the following: Wait activities, Yes/no split activities, Multivariate split activities, and Random split activities.
Wait activity metrics
Journey metrics for wait activities include the following information:
-
Wait completed – The number of journey participants who completed the activity.
-
Wait date passed – The number of journey participants who arrived on the activity and immediately moved to the next activity because the wait date occurred in the past.
-
Currently waiting – The number of participants who are currently waiting (in the activity).
Yes/No split activity metrics
Journey metrics for yes/no split activities include the following information:
-
Total participants – The number of journey participants who passed through the activity.
-
Details for path – The number of journey participants who were sent down each path of the activity.
Multivariate split activity metrics
Journey metrics for multivariate split activities include the following information:
-
Total participants – The number of journey participants who passed through the activity.
-
Details for path – The number of journey participants who were sent down each path of the activity.
Holdout activity metrics
Journey metrics for holdout activities include the following information:
-
Total entered – The number of journey participants who passed through activity.
-
Participants held out – The number of participants who exited the journey because of being held out by the activity.
Random split activity metrics
Journey metrics for random split activities include the following information:
-
Total participants – The number of journey participants who passed through the activity.
-
Details for path – The number of journey participants who were sent down each path of the activity.
