Performance Insights metrics for DB instances
Performance Insights monitors different types of metrics, as discussed in the following sections.
Database load
Database load (DBLoad) is a key metric in Performance Insights that
measures the level of activity in your database. It is collected every second and
automatically published to Amazon CloudWatch. It represents the activity of the DB instance in
average active sessions (AAS), which are the number of sessions that are concurrently
running SQL queries. The DBLoad metric is different from other time-series
metrics, because it can be interpreted by using any of these five dimensions: waits, SQL,
hosts, users, and databases. These dimensions are subcategories of the DBLoad
metric. You can use them as slice by categories to represent different
characteristics of the database load. For a detailed description of how we compute the
database load, see Database
load in the Amazon RDS documentation.
The following screen illustration shows the Performance Insights tool.

Dimensions
-
Wait events are conditions that a database session waits for a resource or another operation to complete in order to continue its processing. If you run an SQL statement such as
SELECT * FROM big_tableand if this table is much bigger than the allocated InnoDB buffer pool, your session will most likely wait forwait/io/file/innodb/innodb_data_filewait events, which are caused by physical I/O operations on the data file. Wait events are an important dimension for database monitoring, because they indicate possible performance bottlenecks. Wait events indicate the resources and operations that the SQL statements you're running within sessions spend the most time waiting for. For example, thewait/synch/mutex/innodb/trx_sys_mutexevent occurs when there is high database activity with a large number of transactions, and thewait/synch/mutex/innodb/buf_pool_mutexevent occurs when a thread has acquired a lock on the InnoDB buffer pool to access a page in memory. For information about all MySQL and MariaDB wait events, see Wait Event Summary Tablesin the MySQL documentation. To understand how to interpret instrument names, see Performance Schema Instrument Naming Conventions in the MySQL documentation. -
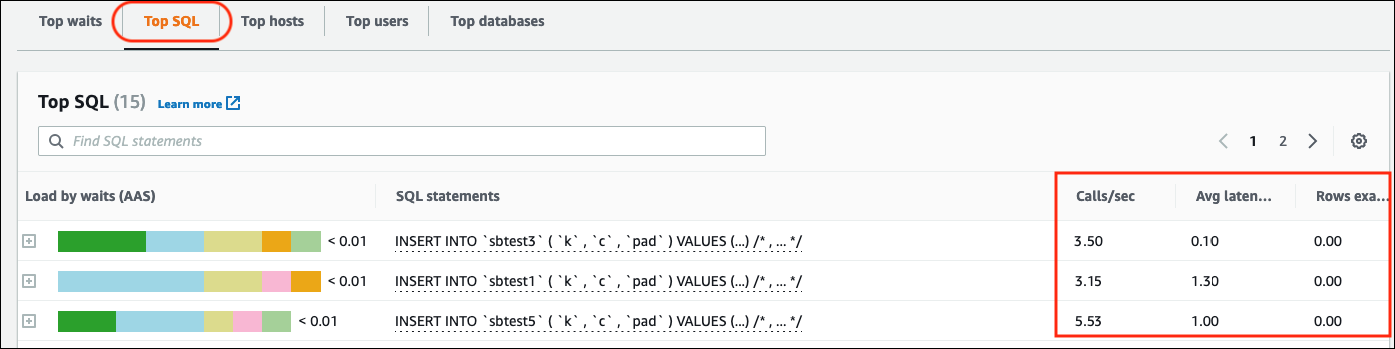
SQL shows which SQL statements are contributing the most to the total database load. The Top dimensions table, which is located under the Database load chart in Amazon RDS Performance Insights, is interactive. You can obtain a detailed list of wait events associated with the SQL statement by clicking the bar in the Load by waits (AAS) column. When you select an SQL statement in the list, Performance Insights displays the associated wait events in the Database load chart and the SQL statement text in the SQL text section. SQL statistics are displayed on the right side of the Top dimensions table.
-
Hosts show the host names of the connected clients. This dimension helps you identify which client hosts are sending most of the load to the database.
-
Users group the DB load by users who are logged in to the database.
-
Databases group the DB load by the name of the database the client is connected to.
Counter metrics
Counter metrics are cumulative metrics whose values can only increase or reset to zero when the DB instance restarts. The value of a counter metric cannot be reduced to its previous value. These metrics represent a single, monotonically increasing counter.
-
Native counters are metrics that are defined by the database engine and not by Amazon RDS. For example:
-
SQL.Innodb_rows_insertedrepresents the number of rows inserted into InnoDB tables. -
SQL.Select_scanrepresents the number of joins that completed a full scan of the first table. -
Cache.Innodb_buffer_pool_readsrepresents the number of logical reads that the InnoDB engine couldn't retrieve from the buffer pool and had to read directly from disk. -
Cache.Innodb_buffer_pool_read_requestsrepresents the number of logical read requests.
For definitions of all native metrics, see Server Status Variables
in the MySQL documentation. -
-
Non-native counters are defined by Amazon RDS. You can obtain these metrics either by using a specific query or derive them by using two or more native metrics in calculations. Non-native counter metrics can represent latencies, ratios, or hit rates. For example:
-
Cache.innoDB_buffer_pool_hitsrepresents the number of read operations that InnoDB could retrieve from the buffer pool without utilizing the disk. It is calculated from the native counter metrics as follows:db.Cache.Innodb_buffer_pool_read_requests - db.Cache.Innodb_buffer_pool_reads -
IO.innoDB_datafile_writes_to_diskrepresents the number of InnoDB data file write operations to disk. It captures only operations on data files―not doublewrite or redo logging write operations. It is calculated as follows:db.IO.Innodb_data_writes - db.IO.Innodb_log_writes - db.IO.Innodb_dblwr_writes
-
You can visualize DB instance metrics directly in the Performance Insights dashboard. Choose Manage Metrics, choose the Database metrics tab, and then select the metrics of interest, as shown in the following illustration.

Choose the Update graph button to display the metrics you selected, as shown in the following illustration.

SQL statistics
Performance Insights gathers performance-related metrics about SQL queries for each second that a query is running and for each SQL call. In general, Performance Insights collects SQL statistics at the statement and digest levels. However, for MariaDB and MySQL DB instances, statistics are collected only at the digest level.
-
Digest statistics is a composite metric of all queries that have the same pattern but eventually have different literal values. The digest replaces specific literal values with a variable; for example:
SELECT department_id, department_name FROM departments WHERE location_id = ? -
There are metrics that represent statistics per second for each digested SQL statement. For example,
sql_tokenized.stats.count_star_per_secrepresents calls per second (that is, how many times per second the SQL statement has been run). -
Performance Insights also includes metrics that provide per call statistics for an SQL statement. For example,
sql_tokenized.stats.sum_timer_wait_per_callshows the average latency of the SQL statement per call, in milliseconds.
SQL statistics are available in the Performance Insights dashboard, in the Top SQL tab of the Top dimensions table.