KPI options
You can customize KPIs in Amazon QuickSight to meet your business needs. You can add contextual sparklines or progress bars, assign primary and secondary values, and add conditional formatting to your KPIs.
To format a KPI in QuickSight, navigate to the KPI that you want to change and choose Format visual to open the Format visual. The icon for the Format visual menu is as follows.

Use the following procedures to perform formatting tasks for KPIs.
Add a visual to a KPI
You can choose to add an area sparkline, a sparkline, or a progress bar to any KPI in QuickSight. Adding visuals to KPIs provides visual context to readers who are viewing KPI data. Use the following procedure to add a visual to a KPI.
To add a visual to a KPI
-
Navigate to the KPI that you want to change and open the format visual menu.
-
In the Properties menu, choose the Visual box to display a visual on your KPI chart.
-
(Optional) Open the Visual dropdown and choose the type of visual that you want to display on your KPI. You can choose to display an area sparkline, a sparkline, or a progress bar. To display a sparkline, make sure that your KPI has a value in the Trend field well. Area sparkline is the default value.
-
(Optional) To change the color of the sparkline, choose the color icon to the left of the Visual dropdown and choose the color that you want. Color formatting isn't supported for the progress bar.
-
(Optional) Choose Add tooltip to add a tooltip to the KPI visual.
The following image shows the Visual section of the Format visual menu.

Customizing primary and secondary values
Use the Format visual menu to customize the font, color, and to choose which primary value is displayed. You can also choose to display a secondary value.
To customize the primary and secondary values of a KPI
-
Navigate to the KPI that you want to change, open the Format visual menu, and navigate to the KPI section.
-
For Primary value, use the Font dropdown to choose the font size that you want. The default value is Auto.
-
(Optional) To change the color of the primary value's font, choose the color icon next to the Font dropdown, and then choose the color that you want.
-
For Primary value displayed, you can choose to display the actual value or the comparison value of the primary value.
-
To add a secondary value, choose Secondary value.
-
(Optional) Use the Font dropdown to choose the font size that you want. The default value is Extra large.
-
(Optional) To change the color of the secondary value's font, choose the color icon next to the Font dropdown, and then choose the color that you want.
-
The following images shows the KPI menu.

Conditional formatting options for KPIs
Conditional formatting for KPIs is automatically set for comparison values. By default, positive values are represented in green and negative values are represented in red. You can customize the color values of these color values from the Properties pane.
To change the color of positive and negative values
-
In the Properties pane, open the Conditional formatting section and choose the comparison value that you want to change.
-
To change the color of the positive value, navigate to Condition #1, choose the Color icon, and then choose the color tht you want.
-
To change the color of the negative value, navigate to Condition #2, choose the Color icon, and then choose the color tht you want.
-
When you are finished making the changes that you want, choose Apply.
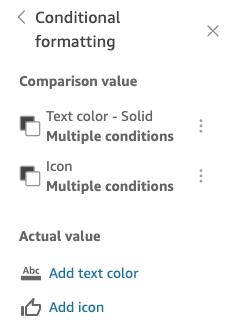
You can also add text colors and icons for the Actual value in thee Conditional formatting menu. To add a text color or icon to the actual value, choose Add text color or Add icon to set the new values. The following image shows the Conditional formatting menu of a KPI.
