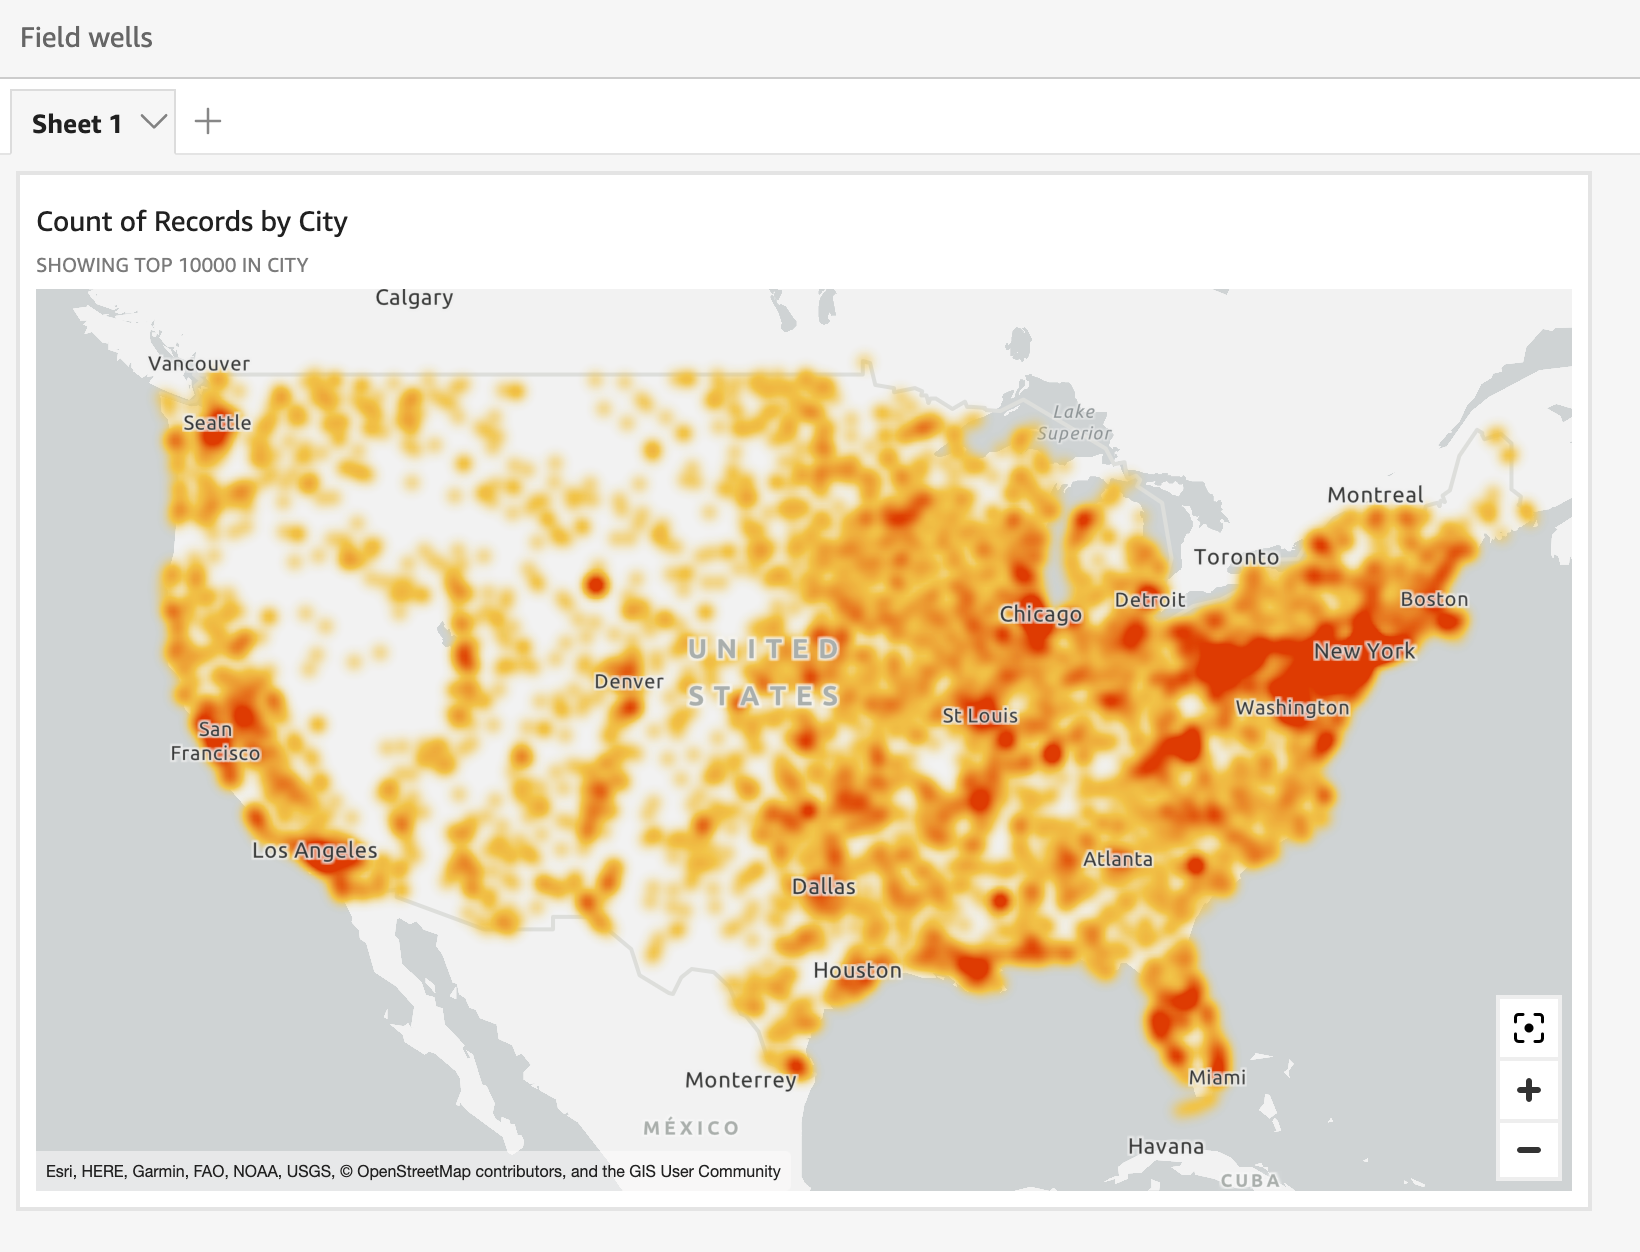
Geospatial heatmaps in Amazon QuickSight
Use geospatial heatmaps to reveal patterns of marker concentration in your geospatial visuals. Heat maps display concentrations of data points using a colored overlay that highlights the intensity or concentration of the visual's markers.
To turn a geospatial map into a heat map
-
Open your analysis and choose the geospatial map that you want to format. When you select a visual, it displays with a highlight around it.
-
To open the formatting pane, select Format visual from the on-visual menu.
-
On the formatting pane at left, choose Points.
-
Choose Heatmap.
-
(Optional) For Heatmap gradient, choose a color that you want for the High density and Low density values.
