Period over period computation
The period over period computation compares values from two different time periods. For example, you can create a computation to find out how much sales increased or decreased since the previous time period.
To use this function, you need at least one dimension in the Time field well.
Parameters
- name
-
A unique descriptive name that you assign or change. A name is assigned if you don't create your own. You can edit this later.
- Date
-
The date dimension that you want to rank.
- Value
-
The aggregated measure that the computation is based on.
Computation outputs
Each function generates a set of output parameters. You can add these outputs to the autonarrative to customize what it displays. You can also add your own custom text.
To locate the output parameters, open the Computations tab on the right, and locate the computation that you want to use. The names of the computations come from the name you provide when you create the insight. Choose the output parameter by clicking on it only once. If you click twice, you add the same output twice. Items displayed in bold can be used in the narrative.
-
timeField– From the Time field well.-
name– The formatted display name of the field. -
timeGranularity– The time field granularity (DAY, YEAR, and so on).
-
-
metricField– From the Values field well.-
name– The formatted display name of the field. -
aggregationFunction– The aggregation used for the metric (SUM, AVG, and so on).
-
-
previousMetricValue– The previous value in the metric dimension.value– The raw value.formattedValue– The value formatted by the metric field.formattedAbsoluteValue– The absolute value formatted by the metric field.
-
previousTimeValue– The previous value in the datetime dimension.value– The raw value.formattedValue– The value formatted by the datetime field.
-
currentMetricValue– The current value in the metric dimension.value– The raw value.formattedValue– The value formatted by the metric field.formattedAbsoluteValue– The absolute value formatted by the metric field.
-
currentTimeValue– The current value in the datetime dimension.value– The raw value.formattedValue– The value formatted by the datetime field.
-
percentDifference– The percent difference between the current and previous values of the metric field.-
value– The raw value of the calculation of the percent difference. -
formattedValue– The formatted value of the percent difference (for example, -42%). -
formattedAbsoluteValue– The formatted absolute value of the percent difference (for example, 42%).
-
-
absoluteDifference– The absolute difference between the current and previous values of the metric field.-
value– The raw value of the calculation of the absolute difference. -
formattedValue– The absolute difference formatted by the settings in the metric field's format preferences. -
formattedAbsoluteValue– The absolute value of the difference formatted by the metric field.
-
Example
To create a Period over period computation
-
In the analysis that you want to change, choose Add insight.
-
For Computation type, choose Period over period, and then choose Select.
-
In the new insight that you created, add the time dimenstion and value dimension fields that you want to compare. In the screenshot below,
Order DateandSales (Sum)are added to the insight. With these two fields selected, QuickSight shows the year to date sales of the latest month and the percentage difference compared with the previous month.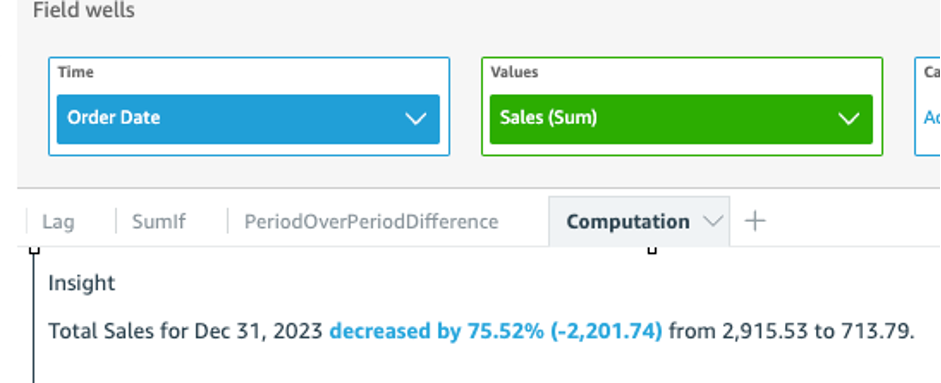
-
(Optional) To further customize the insight, open the on-visual menu and choose Customize narrative. In the Edit narative window that appears, drag and drop the fields that you need from the Computations list, and then choose Save.

