Using small multiples
Use this feature when you need to set multiple comparative visuals in a row. When you activate the small multiples feature, Amazon QuickSight creates a container or shelf of small visuals, presented side-by-side. Each copy of the visual contains a one view of the data. Using small multiples is a way to get a holistic view of your business, in an efficient and interactive way.
Small multiples aren't listed in the palette visualization icons. Instead, the option to create small multiples appears as a field well, in the visuals that support it.
To add small visuals to your analysis
-
On a line, bar, or pie charts, add a field to the Small multiples field well.
-
To see your small multiples, you need to enlarge the container that holds them, so you can see all of them at once.
-
To format the set of small multiples, choose Format visual (the pencil icon) from the menu on the visual. You can adjust the following settings:
-
Layout
-
Visible rows
-
Visible columns
-
Number of panels
-
-
Panel title options (toggle)
-
Font size and color
-
Font weight
-
Text alignment
-
-
Panel order options (toggle)
Line thickness, style, and color
-
Panel gutter (toggle)
Spacing
-
Panel background (toggle)
Background color
-
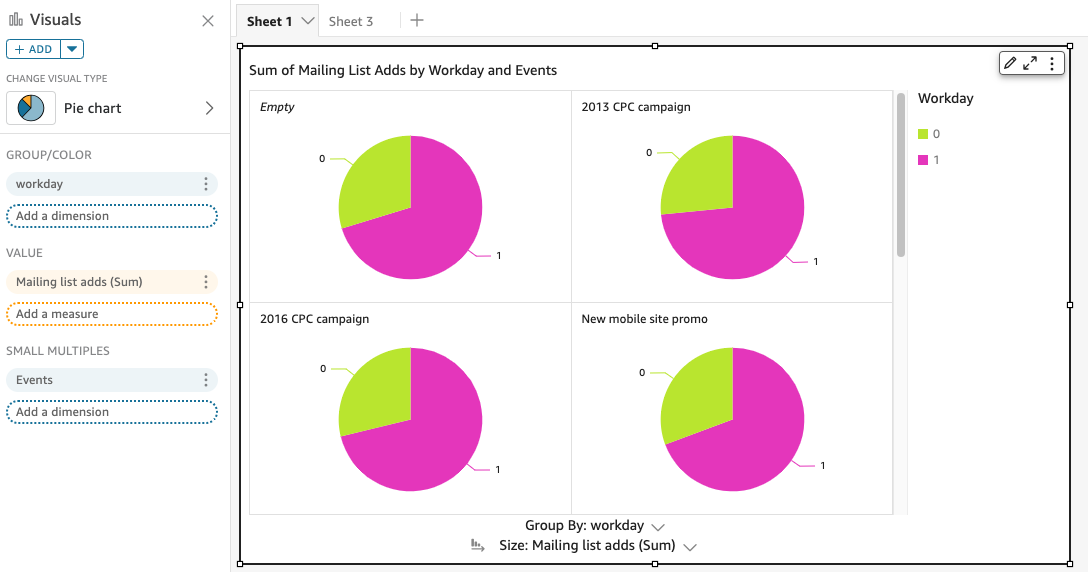
The following screenshot shows an example of small multiples: