Sorting visual data in Amazon QuickSight
You can sort data using multiple methods for most visual types. You can choose the sort order of on-visual data by using the quick sort option or field wells. You can also use field wells to sort data by an off-visual metric. The visual element you can sort by depends on the visual type and whether sorting is supported for that visual. For more information on which visual types support sorting, see Analytics formatting per type in QuickSight.
Pivot tables behave differently than tables when sorting values. For more information about sorting pivot tables, see Sorting pivot tables in Amazon QuickSight.
For SPICE datasets, you can sort text strings of sizes up to the following limitations:
-
Up to two million (2,000,000) unique values
-
Up to 16 columns
When you exceed the limitations, the visual displays a notification at the upper right.
You can sort any visual type that supports sorting. If a visual type supports sorting, you can sort by using either the quick sort option or a field well.
To quickly sort dimensions and measures
-
Do one of the following:
-
Choose the sort icon that appears near the field name on either axis. In direct queries, this icon appears for any data type. For SPICE, this icon is available only for datetime, numeric, and decimal data types.
-
Choose the field name and then choose the sort option from the menu. If the label doesn't display on the axis, check the visual format to see if the axis is set to display labels. The display labels are automatically hidden on smaller visuals. You might need to make the visual large enough to display labels.

-
To sort by using an off-visual metric
-
Open the analysis with the visual that you want to sort. Visuals pane will be open by default.
-
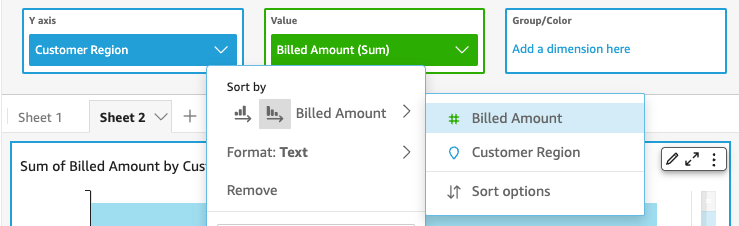
Choose a field well that supports sorting, then choose Sort by, Sort options.

-
On the Sort options pane, sort by specific fields, choose an aggregation, or sort ascending or descending, or do a combination of these.
-
Choose Apply to save your changes. Or choose Clear to start over or Cancel to go back.
To sort by using a field well
-
Open the analysis with the visual that you want to sort. Visuals pane will be open by default.
-
Choose a field well that supports sorting.
-
On the field well menu, choose Sort, and then choose the ascending or descending sort order icon.