Functions for pivot table calculations
You can use the following functions in pivot table calculations.
You can apply functions listed to the following data:
Running total
The Running total function calculates the sum of
a given cell value and the values of all cells prior to it. This sum is
calculated as Cell1=Cell1, Cell2=Cell1+Cell2,
Cell3=Cell1+Cell2+Cell3, and so on.
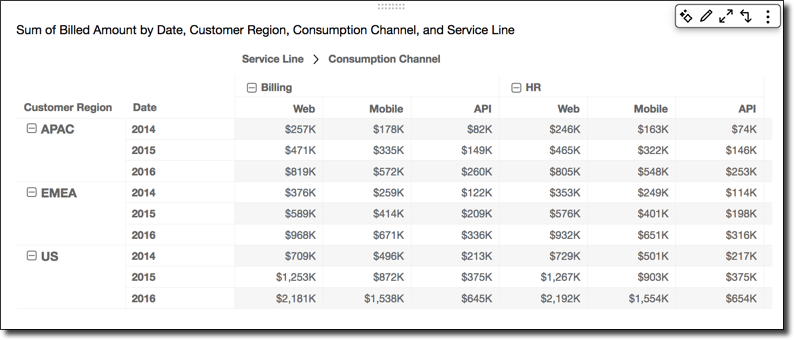
Applying the Running total function across the table rows, using Table across for Calculate as, gives you the following results.

Difference
The Difference function calculates the difference
between a cell value and value of the cell prior to it. This difference
is calculated as Cell1=Cell1-null, Cell2=Cell2-Cell1,
Cell3=Cell3-Cell2, and so on. Because Cell1-null =
null, the Cell1 value is always empty.
Applying the Difference function across the table rows, using Table across for Calculate as, gives you the following results.

Percentage difference
The Percentage Difference function calculates the
percent difference between a cell value and the value of the cell prior
to it, divided by the value of the cell prior to it. This value is
calculated as Cell1=(Cell1-null)/null, Cell2=(Cell2-Cell1)/Cell1,
Cell3=(Cell3-Cell2)/Cell2, and so on. Because
(Cell1-null)/null = null, the Cell1 value is always
empty.
Applying the Percentage Difference function across the table rows, using Table across for Calculate as, gives you the following results.

Percent of total
The Percent of Total function calculates the
percentage the given cell represents of the sum of all of the cells
included in the calculation. This percentage is calculated as
Cell1=Cell1/(sum of all cells), Cell2=Cell2/(sum of all
								cells),
and so on.
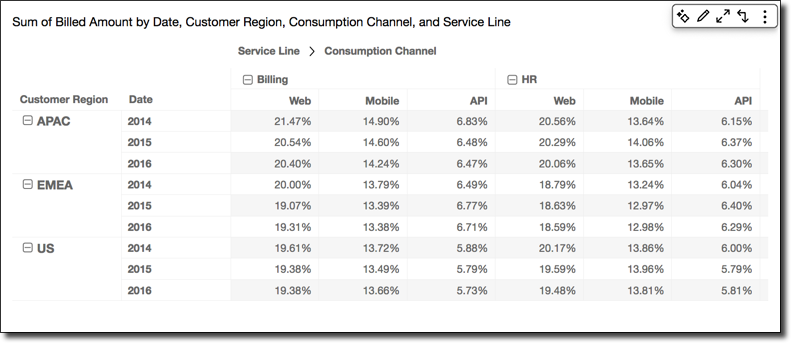
Applying the Percent of Total function across the table rows, using Table across for Calculate as, gives you the following results.
Rank
The Rank function calculates the rank of the cell value compared to the values of the other cells included in the calculation. Rank always shows the highest value equal to 1 and lowest value equal to the count of cells included in the calculation. If there are two or more cells with equal values, they receive the same rank but are considered to take up their own spots in the ranking. Thus, the next highest value is pushed down in rank by the number of cells at the rank above it, minus one. For example, if you rank the values 5,3,3,4,3,2, their ranks are 1,3,3,2,3,6.
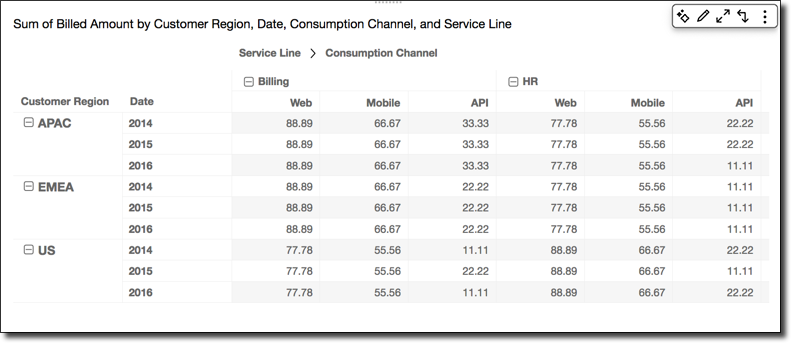
For example, suppose that you have the following data.
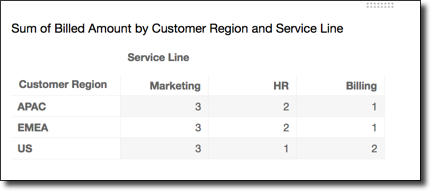
Applying the Rank function across the table rows, using Table across for Calculate as, gives you the following results.
Percentile
The Percentile function calculates the percent of the values of the cells included in the calculation that are at or below the value for the given cell.
This percent is calculated as follows.
percentile rank(x) = 100 * B / N

Where:
   B = number of scores below x
   N = number of scores
Applying the Percentile function across the table rows, using Table across for Calculate as, gives you the following results.