Working with threshold alerts in Amazon QuickSight
| Applies to: Enterprise Edition |
To stay informed about important changes in your data, you can create threshold alerts using KPI, Gauge, Table, and Pivot table visuals in an Amazon QuickSight dashboard. With these alerts, you can set thresholds for your data and be notified by email when your data crosses them. You can also view and manage your alerts at anytime in a QuickSight supported web browser.
For example, let's say that you're a customer success manager for a large organization and you want to know when the number of tickets in a support queue exceeds a certain number. Let's say too that you have a dashboard with a KPI, Gauge, Table or Pivot table visual that tracks the number of tickets in this queue. In this case, you can create an alert and be notified by email when the number exceeds the threshold you specified. That way, you can take action as soon as you're notified.
You can create multiple alerts for a single visual. If the visual is updated or deleted by the author after you create an alert, your alert settings don't change. When you create an alert, the alert takes on any filters applied to the visual at that time. If you or the author changes the filter, your existing alert doesn't change. However, if you create a new alert, your new alert takes on the new filter settings.
For example, let's say you have a dashboard with a filter control that you can use to switch the data for each visual in the dashboard from one US city to another. You have a KPI visual on the dashboard that shows average flight delays, and you're interested in delays for flights leaving from Seattle, Washington, in the US. You change the filter control to Seattle and set an alert on the visual. This alert tracks flight delays from Seattle. Tomorrow, let's say that you want to also track flight delays from Portland, Oregon, so you change the filter control to Portland and create another alert. This new alert tracks flight delays from Portland. You now have two alerts, one on Seattle and one on Portland, working independently.
Threshold alerts are not available in the eu-central-2 Europe (Zurich) region.
For more information on KPI, Guage, Table, or Pivot table visuals, see Visual types in Amazon QuickSight.
Note
You can't create alerts for visuals in an embedded dashboard or from the QuickSight mobile app.
For table visuals, threshold alerts can't be created for values that are located in the Group by field well. Alerts can only be created for values that are located in the Value field well.
KPI visuals that don't use a date-time field as a trend don't support alerts. An example is a KPI that shows the difference in flights between carriers X and Y instead of a KPI that shows the difference in flights between dates A and B.
Creating Alerts
Use the following procedure to create threshold alerts for KPI or Gauge visuals in a dashboard.
To create an alert
-
Open QuickSight and navigate to the dashboard that you want.
For more information about viewing dashboards as a dashboard subscriber in QuickSight, see Interacting with Amazon QuickSight dashboards.
-
In the dashboard, select the visual that you want to create an alert for, open the menu at the upper-right, and choose Create alert.
-
On the menu at upper-right on the visual, choose the Create alert icon.
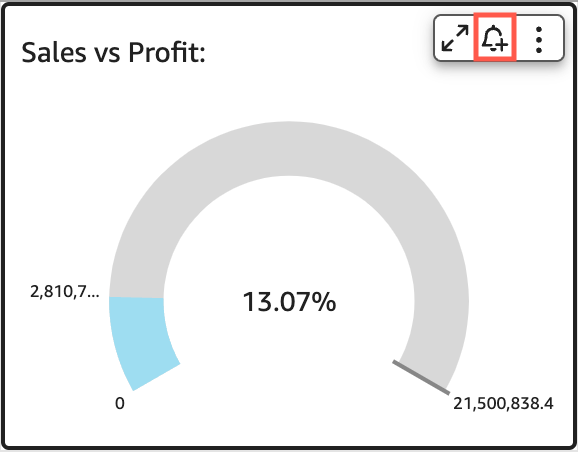
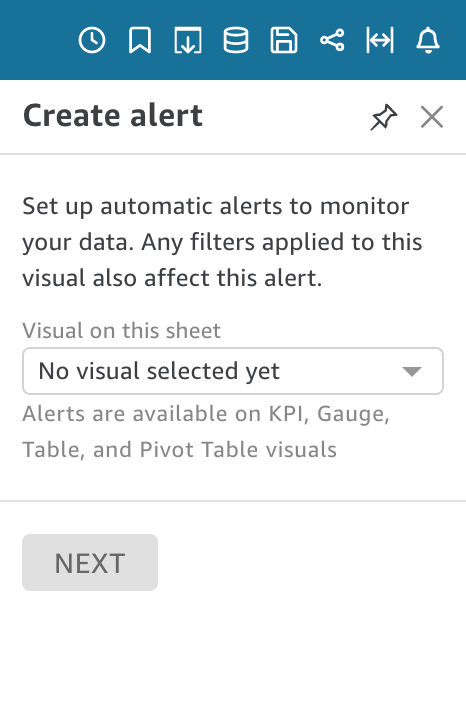
Alternatively, you can choose the alert icon in the blue toolbar at upper right. Then, in the Create alert page that opens, select the KPI, Gauge, Table or Pivot table visual that you want to create an alert for, and then choose Next.
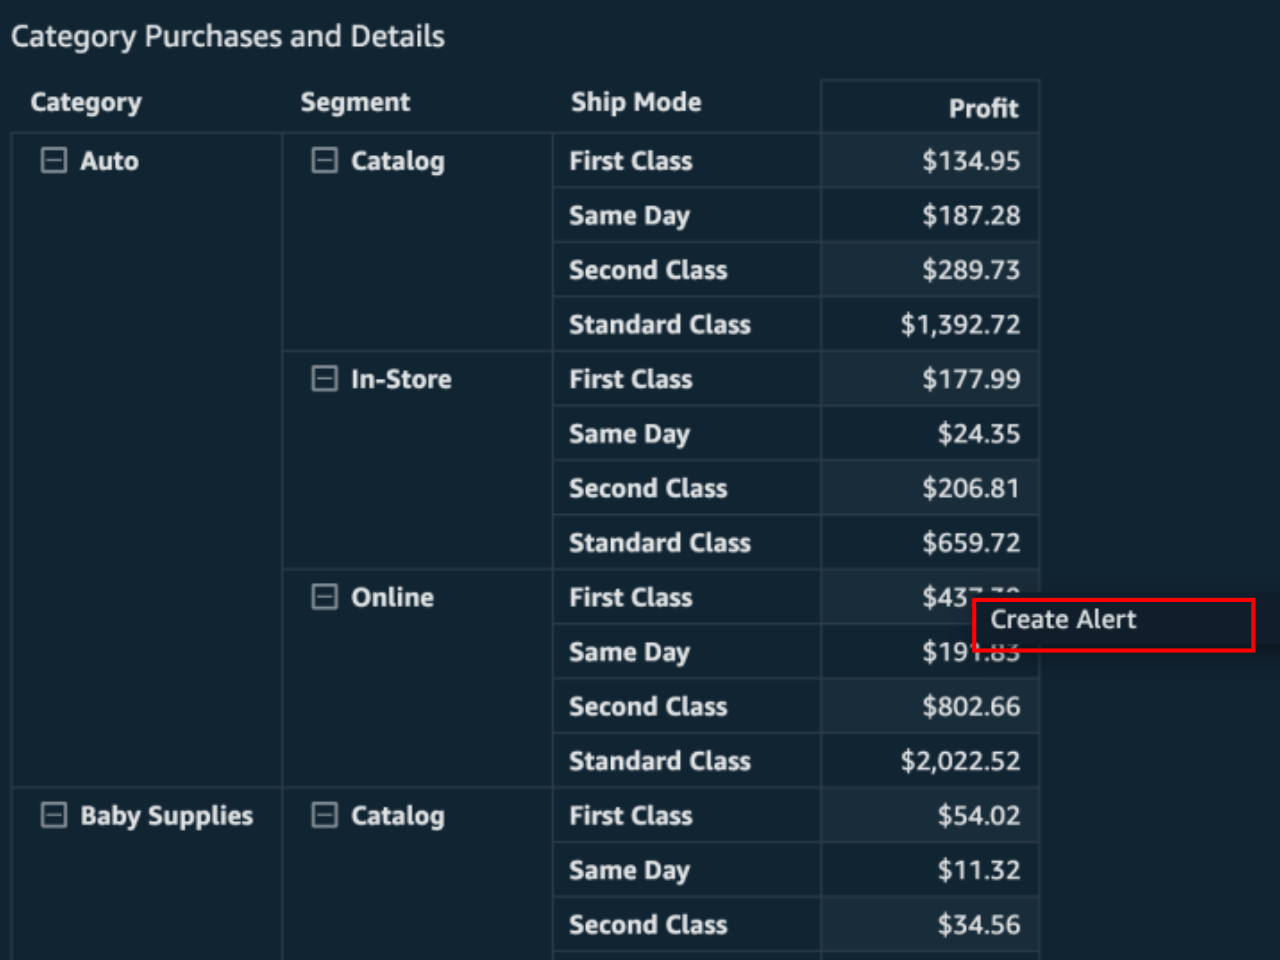
You can also create alerts on table or pivot table visuals by selecing a cell and choosing Create alert. You can only create alerts for single cells. Alerts can't be created for entire columns or for values that use a custom aggregation. For more information about custom aggregations, see Aggregate functions.
-
On the Create alert page that opens at right, do the following:
-
For Name, enter a name for the alert.
By default, the visual name is used for the alert name. You can change it if you want.
-
For Value to track, choose a value that you want to set the threshold for. The information presented will vary based on the visual type you're creating an alert for.
The values that are available for this option are based on the values the dashboard author sets in the visual. For example, let's say you have a KPI visual that shows a percent difference between two dates. Given that, you see two alert value options: percent difference and actual.
If there is only one value in the visual, you can't change this option. It is the current value and it is displayed here so that you can use it as a reference while you choose a threshold. For example, if you're setting an alert on average cost, this value will show you what the current average cost is (say, $5). With this reference value you can make more informed decisions while setting your threshold.
-
For Condition, choose a condition for the threshold.
You can choose the following conditions.
-
Is above – Sets a rule that the alert triggers if the alert value goes above the threshold you set.
-
Is below – Sets a rule that the alert triggers if the alert value goes below the threshold that you set.
-
Is equal to – Sets a rule that the alert triggers if the alert value is equal to the threshold you set.
-
-
For Threshold, enter a value to prompt the alert.
-
For Notification preference, choose how often you want to be notified about a breach to the threshold you set.
You can choose from the following options.
-
As frequently as possible - This option alerts you whenever the threshold is breached. If you choose this option, you might get alerts multiple times a day.
-
Daily at most - This option alerts you once per day when the threshold is breached.
-
Weekly at most - This option alerts you once per week when the threshold is breached.
-
-
(Optional) Choose Email me when there is no data - When you select this option, you're notified when there's no data to check your alert rule against.
-
Choose Save.
A message at upper-right appears indicating that the alert has been saved. If your data crosses the threshold you set, you get a notification by email at the address that's associated with your QuickSight account.
-
Managing Threshold Alerts
You can edit your existing alerts, turn them on or off, or view the history of times when the alert was triggered. Use the following procedures to do so.
To edit an existing alert
-
Open QuickSight, choose Dashboards, and then navigate to the dashboard that you want to edit an alert for.
-
On the Dashboards page, choose Alerts at upper-right.

-
On the Manage alerts page that opens, find the alert that you want to edit, and then choose Edit beneath the alert name.
You can edit the alert name, condition, and threshold.
-
Choose Save.
To view the history of when an alert was triggered
-
Open QuickSight, choose Dashboards, and then navigate to the dashboard that you want to view alert history for.
-
On the Dashboards page, choose Alerts at upper-right.
-
On the Manage alerts page that opens, find the alert that you want to view the history for, and then choose History beneath the alert name.
To turn on or turn off an existing alert
-
Open QuickSight, choose Dashboards, and navigate to the dashboard that you want to turn on or turn off an alert for.
-
On the Dashboards page, choose Alerts at upper-right.
-
On the Manage alerts page that opens, find the alert that you want to turn on or off, and then select or clear the toggle by the alert name.
The alert is turned on when the toggle is blue, and turned off when the toggle is gray.
To delete an existing alert
-
Open QuickSight, choose Dashboards, and navigate to the dashboard that you want to delete an alert from.
-
On the Dashboards page, choose Alerts at upper-right.
-
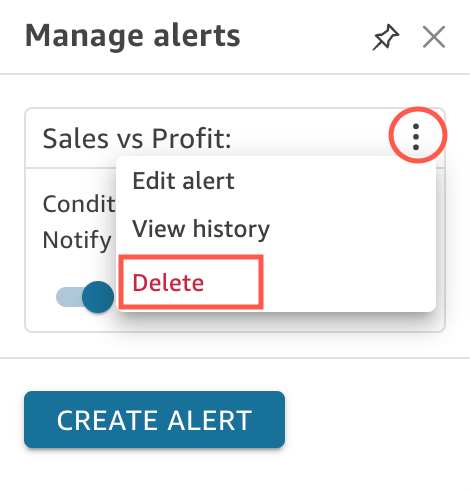
On the Manage alerts page that opens, find the alert that you want to turn on or off, choose the three-dot menu next to the alert, and then choose Delete from the dropdown.
Investigating Alert Failures
When an alert fails, QuickSight sends you an email notification about the failure. Alerts can fail for many reasons, including the following:
-
The dataset the alert is using was deleted.
-
The owner of the alert lost permissions to the dataset or to certain rows or columns in the dataset.
-
The owner of the alert lost access to the dashboard.
-
There is no data for the data tracked by the alert.
When a failure occurs, QuickSight sends you a notification and disables the alert if the reason for the failure isn't likely to be fixed. For example, if the alert fails due to the loss of access to a dashboard, or if the dashboard was deleted. Otherwise, QuickSight attempts to check your data for threshold breaches again. After four failures, QuickSight turns off the alert and notifies you that the alert is turned off. If the alert can be checked again, QuickSight sends you a notification.
To investigate why an alert failed, check that you still have access to the dashboard. Also check that you have permissions to the correct dataset and to the correct rows and columns in the dataset. If you have lost access or permissions, contact the dashboard owner. If you have the necessary access and permissions, you might need to edit your alert to avoid future alert failures.
Alert Scheduling
When you create an alert, QuickSight checks your data for any breaches against the thresholds you set based on when your dataset is scheduled to refresh. The information presented in the alert varies based on the visual type that you're creating an alert for. For SPICE datasets, alert rules are checked after a successful refresh of your SPICE dataset. For direct query datasets, alert rules are checked at a random time between 6:00 PM and 8:00 AM in the AWS Region that holds the dataset by default.
If you're a dataset owner, you can set an alert evaluation schedule in the dataset settings. See the following procedure to learn how.
To set an alert evaluation schedule for a dataset
-
In QuickSight, choose Datasets in the navigation bar at left.
-
Choose the dataset name that you want to schedule alert evaluations for.
-
Choose Set alert schedule.
-
In the Set alert schedule page that opens, do the following.
-
For Time zone, choose a time zone.
-
For Repeats, choose how often you want the data to be evaluated.
-
For Starts, enter the time that you want the alert evaluation to start.
-
Alert Permissions
If you're an administrator, you can control who in your organization can set threshold alerts in QuickSight by creating a custom permissions policy. To set custom permissions in QuickSight, choose your user name at the upper-right corner of any QuickSight page, choose Manage QuickSight, and then choose Manage permissions.
