Amazon Redshift will no longer support the creation of new Python UDFs starting Patch 198.
Existing Python UDFs will continue to function until June 30, 2026. For more information, see the
blog post
Viewing the cluster workload breakdown chart
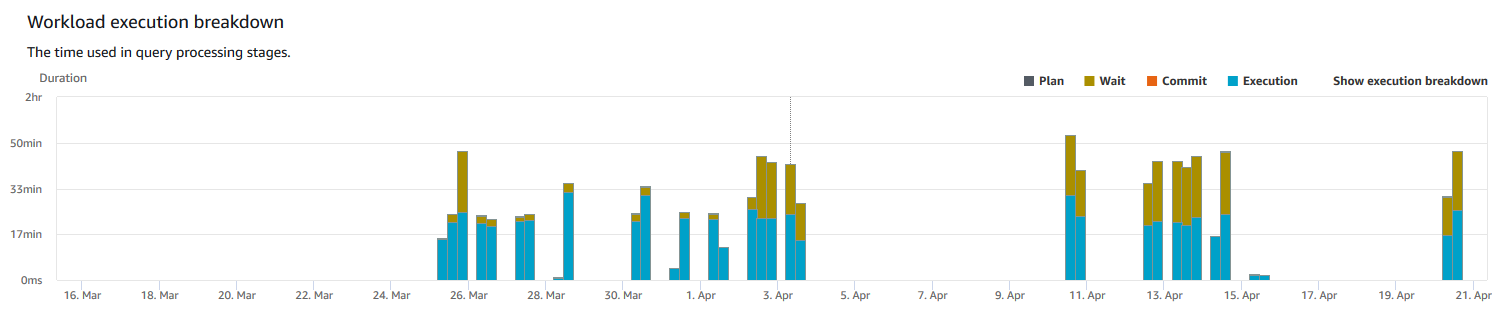
You can get a detailed view of your workload's performance by looking at the Workload execution breakdown chart in the console. We build the chart with data provided by the QueryRuntimeBreakdown metric. With this chart, you can see how much time your queries spend in the various processing stages, such as waiting and planning.
Note
The Workload execution breakdown chart isn't shown for single-node clusters.
The following list of metrics describes the various processing stages:
-
QueryPlanning: Time spent parsing and optimizing SQL statements. -
QueryWaiting: Time spent waiting in the workload management (WLM) queue. -
QueryExecutingRead: Time spent running read queries. -
QueryExecutingInsert: Time spent running insert queries. -
QueryExecutingDelete: Time spent running delete queries. -
QueryExecutingUpdate: Time spent running update queries. -
QueryExecutingCtas: Time spent running CREATE TABLE AS queries. -
QueryExecutingUnload: Time spent running unload queries. -
QueryExecutingCopy: Time spent running copy queries.
For example, the following graph in the Amazon Redshift console shows the amount of time that
queries have spent in the plan, wait, read, and write stages. You can combine the
findings from this graph with other metrics for further analysis. In some cases,
your graph might show that queries with a short duration (as measured by the
QueryDuration metric) are spending a long time in the wait stage.
In these cases, you can increase the WLM concurrency rate for a particular queue to
increase throughput.
Following, is an example of the workload execution breakdown chart. In the chart, the y-axis value is the average duration of each stage at the specified time shown as a stacked bar graph.
The following diagram illustrates how Amazon Redshift aggregates query processing for concurrent sessions.

To view the cluster workload breakdown chart
-
Sign in to the AWS Management Console and open the Amazon Redshift console at https://console.aws.amazon.com/redshiftv2/
. -
On the navigation menu, choose Clusters, then choose the cluster name from the list to open its details. The details of the cluster are displayed, which can include Cluster performance, Query monitoring, Databases, Datashares, Schedules, Maintenance, and Properties tabs.
-
Choose the Query monitoring tab for metrics about your queries.
-
In the Query monitoring section, choose Database performance, and choose Cluster metrics.
The following metrics are graphed for the chosen time range as a stacked bar chart:
-
Plan time
-
Wait time
-
Commit time
-
Execution time
-
