Amazon Redshift will no longer support the creation of new Python UDFs starting November 1, 2025.
If you would like to use Python UDFs, create the UDFs prior to that date.
Existing Python UDFs will continue to function as normal. For more information, see the
blog post
Viewing database performance data
You can use database performance metrics in Amazon Redshift to do the following:
-
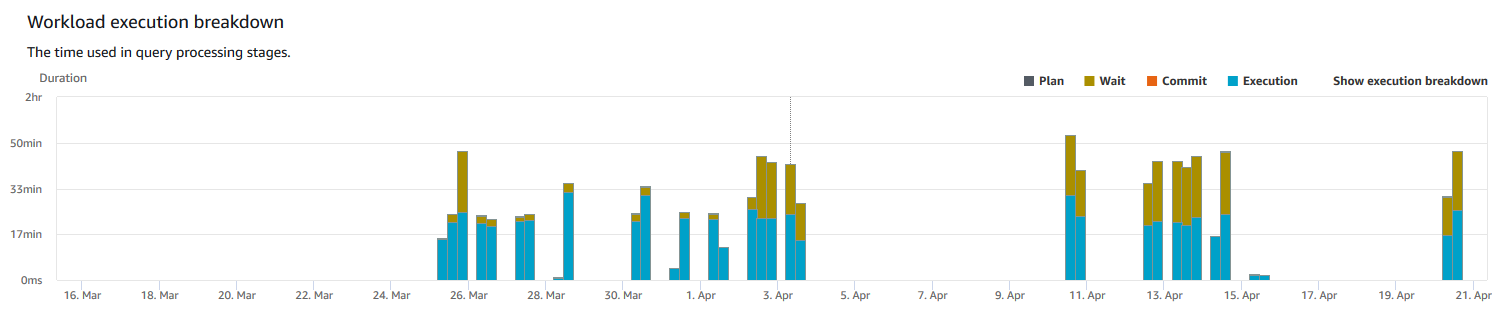
Analyze the time spent by queries by processing stages. You can look for unusual trends in the amount of time spent in a stage.
-
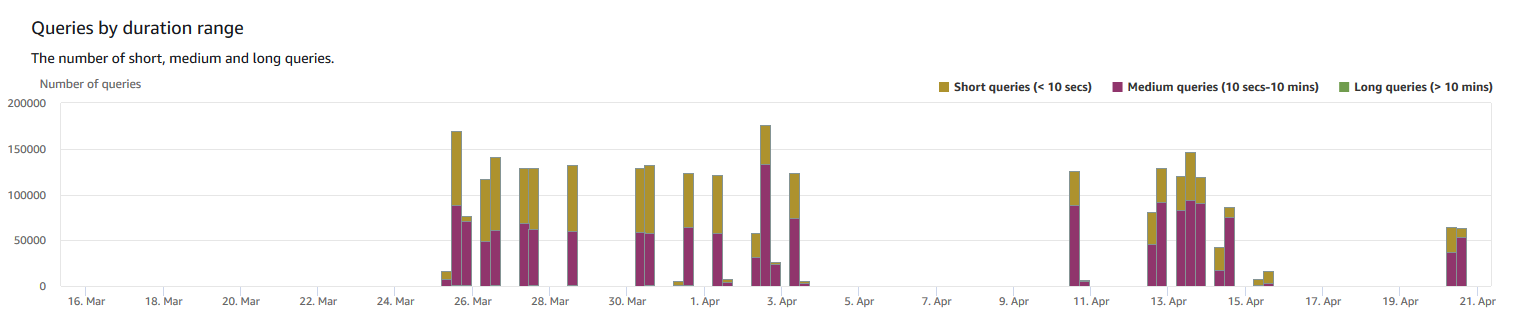
Analyze the number of queries, duration, and throughput of queries by duration ranges (short, medium, long).
-
Look for trends in the about of query wait time by query priority (Lowest, Low, Normal, High, Highest, Critical).
-
Look for trends in the query duration, throughput, or wait time by WLM queue.
To display database performance data
-
Sign in to the AWS Management Console and open the Amazon Redshift console at https://console.aws.amazon.com/redshiftv2/
. -
On the navigation menu, choose Clusters, then choose the cluster name from the list to open its details. The details of the cluster are displayed, including Cluster performance, Query monitoring, Databases, Datashares, Schedules, Maintenance, and Properties tabs.
-
Choose the Query monitoring tab for metrics about your queries.
-
In the Query monitoring section, choose Database performance tab.
Using controls on the window, you can toggle between Cluster metrics and WLM queue metrics.
When you choose Cluster metrics, the tab includes the following graphs:
-
Workload execution breakdown – The time used in query processing stages.
-
Queries by duration range – The number of short, medium, and long queries.
-
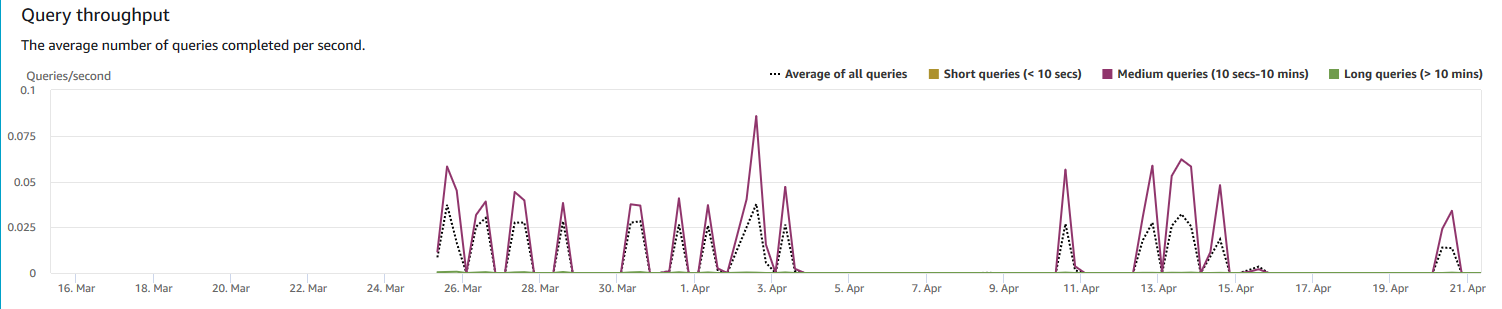
Query throughput – The average number of queries completed per second.
-
Query duration – The average amount of time to complete a query.
-
Average queue wait time by priority – The total time queries spent waiting in the WLM queue by query priority.
When you choose WLM queue metrics, the tab includes the following graphs:
-
Query duration by queue – The average query duration by WLM queue.
-
Query throughput by queue – The average number of queries completed per second by WLM queue.
-
Query wait time by queue – The average duration of queries spent waiting by WLM queue.
-
Database performance graphs
The following examples show graphs that are displayed in the new Amazon Redshift console.
-
Workload execution breakdown
-
Queries by duration range
-
Query throughput
-
Query duration

-
Average queue wait time by priority

-
Query duration by queue

-
Query throughput by queue

-
Query wait time by queue

