View the details of a pipeline run
You can review the details of a particular SageMaker AI pipeline run. This can help you:
-
Identify and resolve problems that may have occurred during the run, such as failed steps or unexpected errors.
-
Compare the results of different pipeline executions to understand how changes in input data or parameters impact the overall workflow.
-
Identify bottlenecks and opportunities for optimization.
To view the details of a pipeline run, complete the following steps based on whether you use Studio or Studio Classic.
- Studio
-
-
Open the SageMaker Studio console by following the instructions in Launch Amazon SageMaker Studio.
-
In the left navigation pane, select Pipelines.
-
(Optional) To filter the list of pipelines by name, enter a full or partial pipeline name in the search field.
-
Select a pipeline name to view details about the pipeline.
-
Choose the Executions tab.
-
Select the name of a pipeline execution to view. The pipeline graph for that execution appears.
-
Choose any of the pipeline steps in the graph to see step settings in the right sidebar.
-
Choose one of the following tabs to view more pipeline details:
-
Definition — The pipeline graph, including all steps.
-
Parameters – Includes the model approval status.
-
Details – The metadata associated with the pipeline, such as tags, the pipeline Amazon Resource Name (ARN), and role ARN. You can also edit the pipeline description from this page.
-
-
- Studio Classic
-
-
Sign in to Amazon SageMaker Studio Classic. For more information, see Launch Amazon SageMaker Studio Classic.
-
In the Studio Classic sidebar, choose the Home icon (
 ).
). -
Select Pipelines from the menu.
-
To narrow the list of pipelines by name, enter a full or partial pipeline name in the search field.
-
Select a pipeline name. The pipeline's Executions page opens.
-
In the Executions page, select an execution name to view details about the execution. The execution details tab opens and displays a graph of the steps in the pipeline.
-
To search for a step by name, type characters that match a step name in the search field. Use the resizing icons on the lower-right side of the graph to zoom in and out of the graph, fit the graph to screen, and expand the graph to full screen. To focus on a specific part of the graph, you can select a blank area of the graph and drag the graph to center on that area.

-
Choose one of the pipeline steps in the graph to see details about the step. In the preceding screenshot, a training step is chosen and displays the following tabs:
-
Input – The training inputs. If an input source is from Amazon Simple Storage Service (Amazon S3), choose the link to view the file in the Amazon S3 console.
-
Output – The training outputs, such as metrics, charts, files, and evaluation outcome. The graphs are produced using the Tracker
APIs. -
Logs – The Amazon CloudWatch logs produced by the step.
-
Info – The parameters and metadata associated with the step.
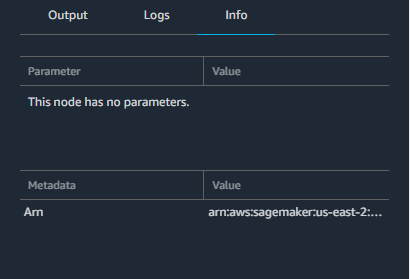
-
-
