Using CloudWatch Application Insights to monitor an application
In Application Manager, a component of AWS Systems Manager, the Monitoring tab displays Amazon CloudWatch Application Insights and alarm details for resources in an application.
About Application Insights
CloudWatch Application Insights identifies and sets up key metrics, logs, and alarms across your application resources and technology stack. Application Insights continuously monitors metrics and logs to detect and correlate anomalies and errors. When the system detects errors or anomalies, Application Insights generates CloudWatch Events that you can use to set up notifications or take actions. If you choose the Edit configuration button on the Monitoring tab, the system opens the CloudWatch Application Insights console. For more information about Application Insights, see What is Amazon CloudWatch Application Insights in the Amazon CloudWatch User Guide.
Actions you can perform on this page
You can perform the following actions on this page:
-
Choose a service name in the Alarms by AWS service section to open CloudWatch to the selected service and alarm.
-
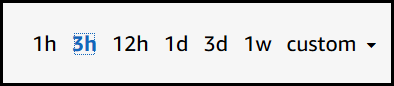
Adjust the time period for data displayed in widgets in the Recent alarms section by selecting one of the predefined time period values. You can choose custom to define your own time period.
-
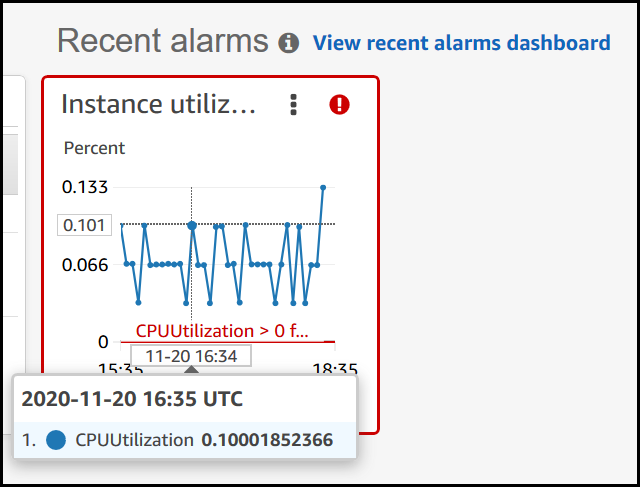
Hover your cursor over a widget in the Recent alarms section to view a data pop-up for a specific time.
-
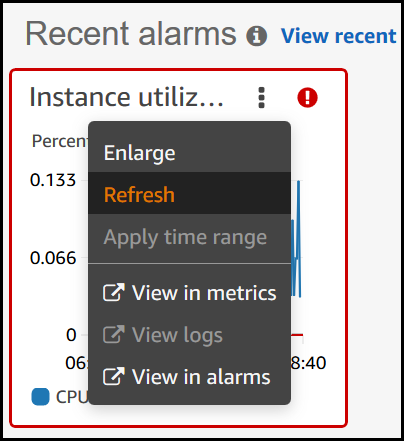
Choose the options menu in a widget to view display options. Choose Enlarge to expand a widget. Choose Refresh to update the data in a widget. Click and drag your cursor in a widget data display to select a specific range. You can then choose Apply time range.
-
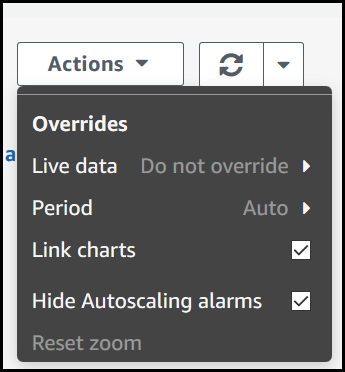
Choose the Actions menu to view alarm data Override options, which include the following:
-
Choose whether your widget displays live data. Live data is data published within the last minute that hasn't been fully aggregated. If live data is turned off, only data points with an aggregation period of at least one minute in the past are shown. For example, when using 5-minute periods, the data point for 12:35 would be aggregated from 12:35 to 12:40, and displayed at 12:41.
If live data is turned on, the most recent data point is shown as soon as any data is published in the corresponding aggregation interval. Each time you refresh the display, the most recent data point might change as new data within that aggregation period is published.
-
Specify a time period for live data.
-
Link the charts in the Recent alarms section, so that when you zoom in or zoom out on one chart, the other chart zooms in or zooms out at the same time. You can unlink charts to limit zoom to one chart.
-
Hide Auto Scaling alarms.
-
To open the Monitoring tab
Open the AWS Systems Manager console at https://console.aws.amazon.com/systems-manager/
. -
In the navigation pane, choose Application Manager.
-
In the Applications section, choose a category. If you want to open an application you created manually in Application Manager, choose Custom applications.
-
Choose the application in the list. Application Manager opens the Overview tab.
-
Choose the Monitoring tab.
